- Analytics
- Technical Analysis
USD/CHF Technical Analysis - USD/CHF Trading: 2014-10-20
Bearish sentiment
Good afternoon, dear traders. Today we consider the USD/CHF currency pair on the D1 chart. At the moment we can see that the price came out of the uptrend price channel and crossed the trend line downwards. The candlestick pattern “absorption” indicates the trend reversal: the body of the second bearish candlestick exceeds significantly the body of the previous white candlestick (marked in red ellipse on the chart). That means the bullish trend is weak, and now bears are gaining strength. There is no contradiction on the part of the RSI-Bars oscillator: the graphic model “double top” can be observed on the oscillator chart. It outlines the bullish trend termination and the onset of the bearish one. The current downtrend direction is confirmed by the Parabolic values. You can wait for the last confirmatory signal from DonchianChannel, when the price breaks the fractal support level at 0.9358. This mark can be used for placing a pending sell order. Stop Loss is recommended to be placed at 0.9687. The mark is confirmed by Bill Williams fractal, the upper boundary of DonchianChannel and Parabolic values.
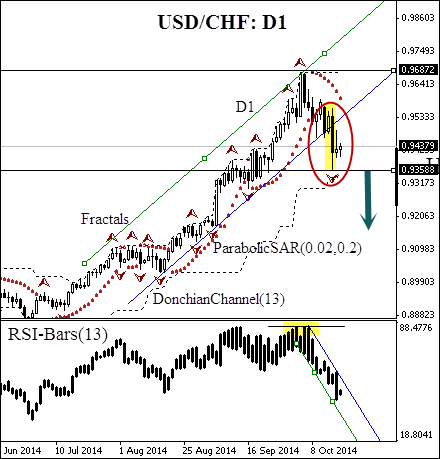
| Position | Sell |
| Sell stop | below 0.93588 |
| Stop loss | above 0.96872 |
Dear traders. You can see the detailed report of the author’s account by clicking here.
- Get Certificate

Note:
This overview has an informative and tutorial character and is published for free. All the data, included in the overview, are received from public sources, recognized as more or less reliable. Moreover, there is no guarantee that the indicated information is full and precise. Overviews are not updated. The whole information in each overview, including opinion, indicators, charts and anything else, is provided only for familiarization purposes and is not financial advice or а recommendation. The whole text and its any part, as well as the charts cannot be considered as an offer to make a deal with any asset. IFC Markets and its employees under any circumstances are not liable for any action taken by someone else during or after reading the overview.
