- Analytics
- Technical Analysis
USD/CHF Technical Analysis - USD/CHF Trading: 2015-02-09
Avoiding false breakouts
Let us consider the USD/CHF H4 chart. The instrument clearly moves sideways, depreciating trend indicators. That is why our attention is drawn mainly to graphic patterns and oscillators, able to filter out false breakouts. At the moment we observe a bearish-biased triangle. The trend is also confirmed by the RSI-Bars oscillator, indicating the movement towards the red zone. In this regard we deal with sell signals only.
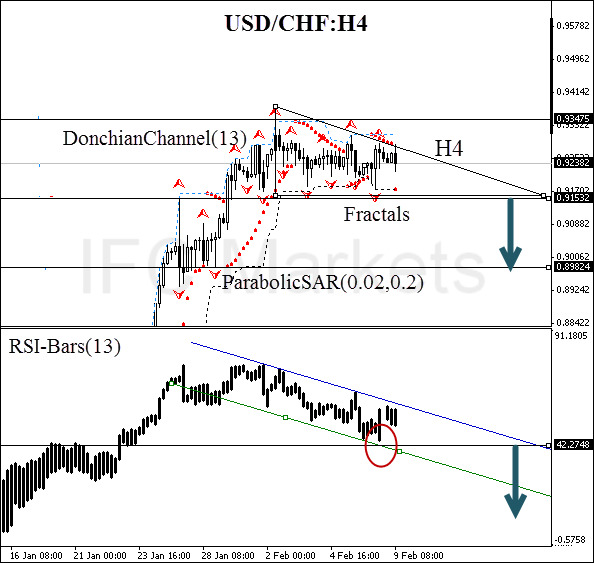
An important support line is formed currently at 0.91532. It is confirmed by the Donchian Channel lower boundary and 2 Bill Williams fractals. We recommend making sure the support breakout is accompanied with breaching the oscillator support of 42.2748%. A sell pending order may be placed at this level. Stop loss may be placed at the triangle height of 0.93475. This mark is also confirmed by the Parabolic values. You may partly close the position at 0.89824, which conforms to historical fractal support. After pending order activation, Stop loss is to be moved every four hours near the next fractal high, following Parabolic signals. Thus, we are changing the probable profit/loss ratio to the breakeven point. If the price meets Stop loss level without reaching the order, we recommend canceling the position: market sustains internal changes that were not considered.
| Position | Sell |
| Sell stop | below 0.91532 |
| Stop loss | above 0.93475 |
- Get Certificate

Note:
This overview has an informative and tutorial character and is published for free. All the data, included in the overview, are received from public sources, recognized as more or less reliable. Moreover, there is no guarantee that the indicated information is full and precise. Overviews are not updated. The whole information in each overview, including opinion, indicators, charts and anything else, is provided only for familiarization purposes and is not financial advice or а recommendation. The whole text and its any part, as well as the charts cannot be considered as an offer to make a deal with any asset. IFC Markets and its employees under any circumstances are not liable for any action taken by someone else during or after reading the overview.
