- एनालिटिक्स
- टेक्निकल एनालिसिस
सोयाबीन तकनीकी विश्लेषण - सोयाबीन ट्रेडिंग: 2015-11-26
Is upward correction to continue?
The soy prices dipped to fresh low of 6.5 years on Monday and are edging up now amid the drought in India. Will the prices continue to correct upwards?
The soy prices fell to the multiyear lows after the opposition leader Mauricio Macri won the presidential elections in Argentina. Previously, he promised to cut considerably the export duties and to devaluate the national currency to support the local farmers. Due to this, markets expect the 30% increased supply of the Argentina’s soy in the global markets till 2019. The head of the big agribusiness Los Grobo forecasts the soy production in Argentina to increase by 50% in 3 years. Now this positive news is partly offset by the drought in India. The country imports vegetable oil for the value of $10bn. In October its import increased by 34% amounting to 1.65mln tonnes, according to Solvent Extractors' Association. In 2014/15 season the vegetable oil imports increased by 23.6% to 14.6mln tonnes while the soybean oil imports increased to 3mln tonnes from 1.95mln tonnes last season. The major supplier of the palm butter to India is Indonesia but we witness the growing share of high-quality soybean oil.
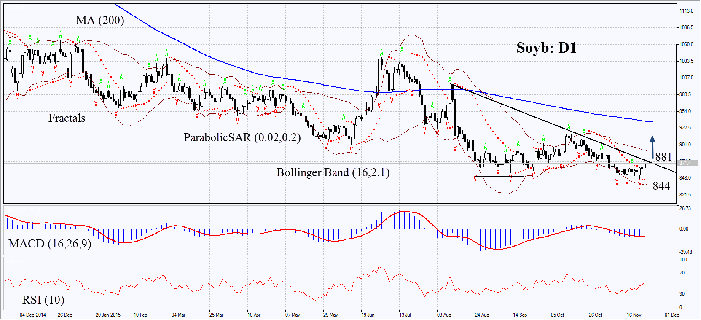
On the daily chart the Soyb: D1 is consolidated near its lowest in 6.5 years. The MACD and Parabolic indicators have formed buy signals. The Bollinger bands have contracted which may mean lower volatility. RSI is above 50, no divergence. The bullish trend may continue in case soy prices break through the resistance of the downtrend at 881. This level may serve the point of entry. The initial risk-limit may be placed below the last lower Parabolic signal, fractal and 6.5-year low at 844. Having opened the pending order we shall move the stop to the next fractal low following the Parabolic and Bollinger signals. Thus, we are changing the probable profit/loss ratio to the breakeven point. The most risk-averse traders may switch to the 4-hour chart after the trade and place there a stop-loss moving it in the direction of the trade. If the price meets the stop-loss level at 844 without reaching the order at 881, we recommend cancelling the position: the market sustains internal changes which were not taken into account.
| Position | Buy |
| Buy stop | above 881 |
| Stop loss | below 844 |
- प्रमाण पत्र प्राप्त करेंe

ध्यान दें:
यह ओवरव्यू एक जानकारीपूर्ण और ट्यूटोरियल चरित्र है और मुफ्त में प्रकाशित किया जाता है. सभी डेटा, ओवरव्यू में शामिल, सार्वजनिक स्रोतों से प्राप्त कर रहे हैं, कम या ज्यादा विश्वसनीय रूप में मान्यता प्राप्त. अतिरिक्त, संकेत दिया जानकारी पूर्ण और सटीक है कि कोई गारंटी नहीं है. ओवरव्यू अद्यतन नहीं हैं . प्रत्येक ओवरव्यू में पूरी जानकारी, भी शामिल राय, इंडीकेटर्स , चार्ट और कुछ और, परिचय उद्देश्यों के लिए ही प्रदान की जाती है और वित्तीय सलाह या सिफारिश नहीं है. पूरे पाठ और उसके किसी भी हिस्से, और साथ हीचार्ट किसी भी संपत्ति के साथ एक सौदा करने के लिए एक प्रस्ताव के रूप में नहीं माना जा सकता है . IFC मार्केट्स और किसी भी परिस्थिति में अपने कर्मचारियों को किसी और के द्वारा की गई किसी कार्रवाई के दौरान लिए उत्तरदायी नहीं हैं या ओवरव्यू पढ़ने के बाद.
