- एनालिटिक्स
- टेक्निकल एनालिसिस
USD/CHF तकनीकी विश्लेषण - USD/CHF ट्रेडिंग: 2024-03-29
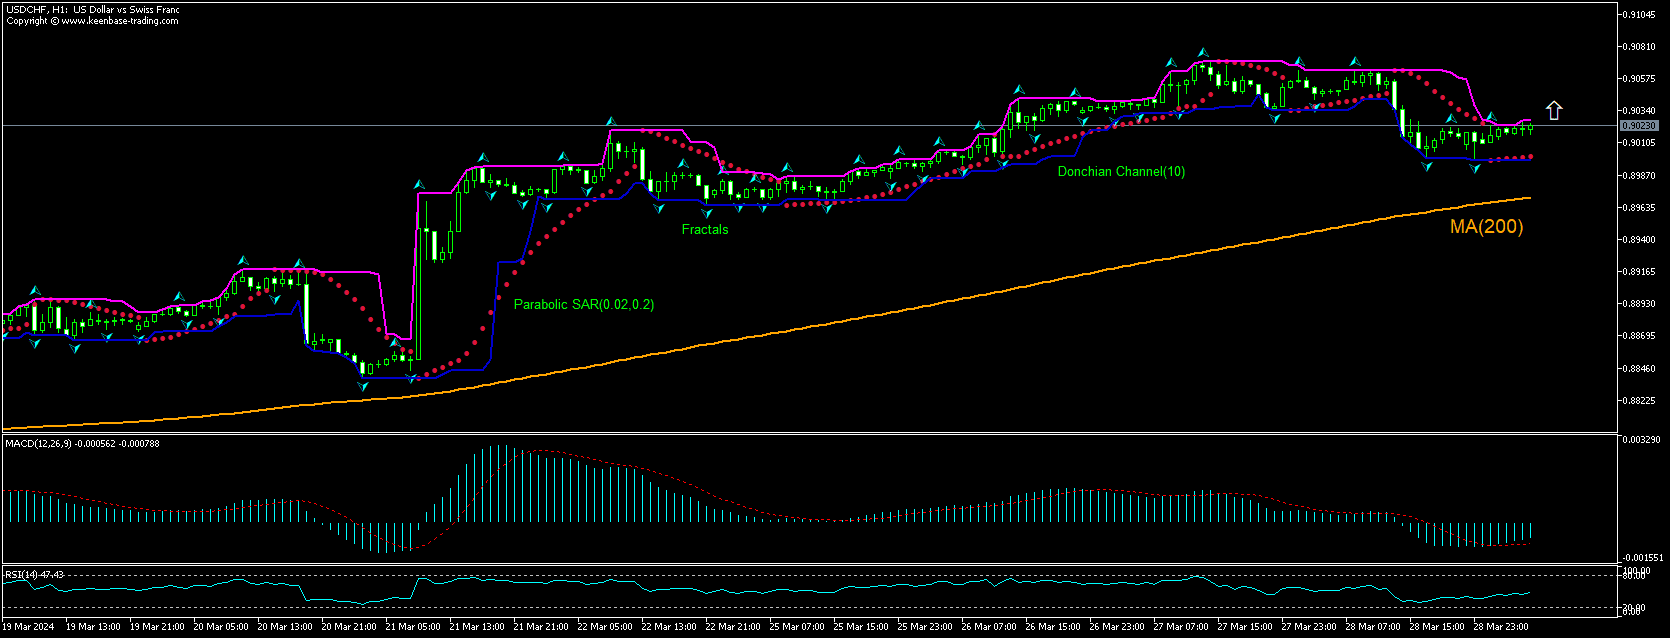
USD/CHF तकनीकी विश्लेषण सारांश
उपरोक्त 0.9027
Buy Stop
से नीचे 0.8997
Stop Loss
| संकेतक | संकेत |
| RSI | तटस्थ |
| MACD | खरीदें |
| Donchian Channel | तटस्थ |
| MA(200) | खरीदें |
| Fractals | तटस्थ |
| Parabolic SAR | खरीदें |
USD/CHF चार्ट विश्लेषण
USD/CHF तकनीकी विश्लेषण
The technical analysis of the USDCHF price chart on 1-hour timeframe shows USDCHF,H1 is retracing higher above the 200-period moving average MA(200) after retreating to two-day low yesterday. We believe the bullish momentum will continue after the price breaches above the upper bound of the Donchian channel at 0.9027. A level above this can be used as an entry point for placing a pending order to buy. The stop loss can be placed below 0.8997. After placing the order, the stop loss is to be moved to the next fractal low indicator, following Parabolic signals. Thus, we are changing the expected profit/loss ratio to the breakeven point. If the price meets the stop loss level without reaching the order, we recommend cancelling the order: the market has undergone internal changes which were not taken into account.
मौलिक विश्लेषण FOREX - USD/CHF
KOF economic index for Switzerland declined again in March. Will the USDCHF price rebound continue?
The KOF Economic Research Agency reported the KOF Economic Barometer index declined to 101.5 points in March from 102.0 in February when an increase to 102.1 was expected. The decline was mainly attributed to declines in construction and private consumption sectors. Meanwhile, indicators for the finance and insurance sectors improved slightly. Weaker performance of Swiss economy is bearish for the Swiss franc and bullish for USDCHF currency pair.
ध्यान दें:
यह ओवरव्यू एक जानकारीपूर्ण और ट्यूटोरियल चरित्र है और मुफ्त में प्रकाशित किया जाता है. सभी डेटा, ओवरव्यू में शामिल, सार्वजनिक स्रोतों से प्राप्त कर रहे हैं, कम या ज्यादा विश्वसनीय रूप में मान्यता प्राप्त. अतिरिक्त, संकेत दिया जानकारी पूर्ण और सटीक है कि कोई गारंटी नहीं है. ओवरव्यू अद्यतन नहीं हैं . प्रत्येक ओवरव्यू में पूरी जानकारी, भी शामिल राय, इंडीकेटर्स , चार्ट और कुछ और, परिचय उद्देश्यों के लिए ही प्रदान की जाती है और वित्तीय सलाह या सिफारिश नहीं है. पूरे पाठ और उसके किसी भी हिस्से, और साथ हीचार्ट किसी भी संपत्ति के साथ एक सौदा करने के लिए एक प्रस्ताव के रूप में नहीं माना जा सकता है . IFC मार्केट्स और किसी भी परिस्थिति में अपने कर्मचारियों को किसी और के द्वारा की गई किसी कार्रवाई के दौरान लिए उत्तरदायी नहीं हैं या ओवरव्यू पढ़ने के बाद.


