- एनालिटिक्स
- टेक्निकल एनालिसिस
USD/CAD तकनीकी विश्लेषण - USD/CAD ट्रेडिंग: 2014-10-30
Oil or FOMC?
Yesterday the Federal Open Market Committee (FOMC) minutes revealed the statement confirming the QE3 completion in late October. This decision will result in a steady volume reduction of long-term government bonds purchases. Note that the US Q2 GDP rose 4.6% YoY. Besides, it is planned to keep interest rates at 0-0.25% per annum to maintain economic development with the help of available commercial loans. The main determinants of monetary policy remain to be unemployment and inflation rates. As it was pointed out in the statement, the base rate may be revised only in case the rate exceeds the threshold of 2%. The FOMC statement caused a significant dollar consolidation against the most liquid currencies.
Today we expect the quarterly US GDP release and Unemployment Claims. If the indicator values are at the expected level, we should wait for the general trend to be continued. A relatively modest reaction is observed only by the Canadian dollar. It is explained by the slow recovery in oil prices, which are now traded at $81 per barrel (WTI). Taking the oil component of Canadian exports into account, this fact provides confidence for investors regarding the Canadian currency. However, it is still too early to talk about a steady trend, so if the US figures are confirmed, we would expect the highs of the USDCAD to be updated.
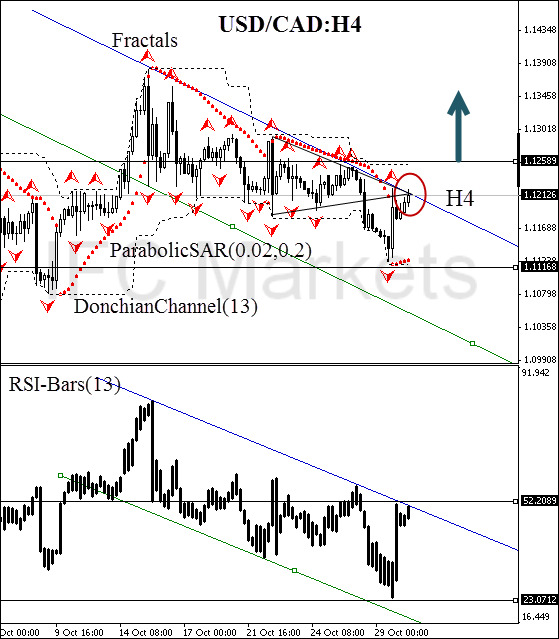
After position opening, Trailing Stop is to be moved after the Parabolic values, near the next fractal low. Updating is enough to be done every day after a new Bill Williams fractal formation (5 candlesticks). Thus, we are changing the probable profit/loss ratio to the breakeven point.
| Position | Buy |
| Buy stop | above 1.12589 |
| Stop loss | below 1.11168 |
Dear traders. You can see the detailed report of the author’s account by clicking here.
- प्रमाण पत्र प्राप्त करेंe

ध्यान दें:
यह ओवरव्यू एक जानकारीपूर्ण और ट्यूटोरियल चरित्र है और मुफ्त में प्रकाशित किया जाता है. सभी डेटा, ओवरव्यू में शामिल, सार्वजनिक स्रोतों से प्राप्त कर रहे हैं, कम या ज्यादा विश्वसनीय रूप में मान्यता प्राप्त. अतिरिक्त, संकेत दिया जानकारी पूर्ण और सटीक है कि कोई गारंटी नहीं है. ओवरव्यू अद्यतन नहीं हैं . प्रत्येक ओवरव्यू में पूरी जानकारी, भी शामिल राय, इंडीकेटर्स , चार्ट और कुछ और, परिचय उद्देश्यों के लिए ही प्रदान की जाती है और वित्तीय सलाह या सिफारिश नहीं है. पूरे पाठ और उसके किसी भी हिस्से, और साथ हीचार्ट किसी भी संपत्ति के साथ एक सौदा करने के लिए एक प्रस्ताव के रूप में नहीं माना जा सकता है . IFC मार्केट्स और किसी भी परिस्थिति में अपने कर्मचारियों को किसी और के द्वारा की गई किसी कार्रवाई के दौरान लिए उत्तरदायी नहीं हैं या ओवरव्यू पढ़ने के बाद.
