- एनालिटिक्स
- टेक्निकल एनालिसिस
USD/JPY तकनीकी विश्लेषण - USD/JPY ट्रेडिंग: 2014-10-22
Japanese yen choosing way
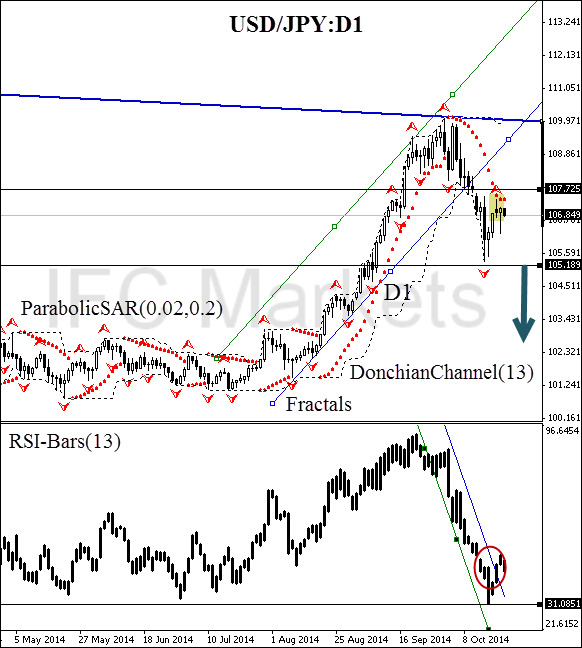
Today we consider the USD/JPY currency pair on the D1 chart. The price made a reversal, touching the strong W1 resistance line. The daily uptrend channel is breached in the direction of the red zone, and now we have every reason to believe that a new bearish D1 trend is emerging. Parabolic confirms the trend direction and moves along the DonchianChannel lower boundary, verifying the price direction. The only alarming signal can be seen at the moment is the breach of RSI-Bars resistance line, which may be proved false. To confirm the bearish sentiment, you should wait for the oscillator level crossing at 31.0851%.
This event is expected to happen before the fractal support breach at 105.189. This mark is strengthened by DonchianChannel lower boundary and can be used for placing a pending sell order. Stop Loss can be placed at 107.725 or 109.971 (for conservative traders). It should be noted that the importance of the last fractal peak is confirmed by the Parabolic historical value, and also the bearish candlestick pattern “shooting star”, which is marked in yellow on the chart.
After position opening, Trailing Stop is to be moved after the Parabolic values, near the next fractal peak. Updating is enough to be done every day after the formation of 5 new candlesticks, needed for the Bill Williams fractal formation. Thus, we are changing the probable profit/loss ratio to the breakeven point.
| Position | Sell |
| Sell stop | below 105.189 |
| Stop loss | above 107.725 |
Dear traders. You can see the detailed report of the author’s account by clicking here.
- प्रमाण पत्र प्राप्त करेंe

ध्यान दें:
यह ओवरव्यू एक जानकारीपूर्ण और ट्यूटोरियल चरित्र है और मुफ्त में प्रकाशित किया जाता है. सभी डेटा, ओवरव्यू में शामिल, सार्वजनिक स्रोतों से प्राप्त कर रहे हैं, कम या ज्यादा विश्वसनीय रूप में मान्यता प्राप्त. अतिरिक्त, संकेत दिया जानकारी पूर्ण और सटीक है कि कोई गारंटी नहीं है. ओवरव्यू अद्यतन नहीं हैं . प्रत्येक ओवरव्यू में पूरी जानकारी, भी शामिल राय, इंडीकेटर्स , चार्ट और कुछ और, परिचय उद्देश्यों के लिए ही प्रदान की जाती है और वित्तीय सलाह या सिफारिश नहीं है. पूरे पाठ और उसके किसी भी हिस्से, और साथ हीचार्ट किसी भी संपत्ति के साथ एक सौदा करने के लिए एक प्रस्ताव के रूप में नहीं माना जा सकता है . IFC मार्केट्स और किसी भी परिस्थिति में अपने कर्मचारियों को किसी और के द्वारा की गई किसी कार्रवाई के दौरान लिए उत्तरदायी नहीं हैं या ओवरव्यू पढ़ने के बाद.
