- एनालिटिक्स
- टेक्निकल एनालिसिस
गोल्ड तकनीकी विश्लेषण - गोल्ड ट्रेडिंग: 2014-10-28
Gold rush: final round
Markets are frozen in the situation of uncertainty: minutes of Federal Open Market Committee are expected to be announced today, which will define the near future of the monetary policy. The Fed is assumed to be ready to complete the QE program: the economy recovery is being maintained, the labor market is quite stable. However, it is possible that the measures may be temporarily put off, due to highly volatile financial markets. If the basic expectations would still be justified, we should expect the immediate US currency strengthening and the fallen prices on precious metals futures. The latter is more likely to happen also due to the recovery continuation in the US stock market, and investors tend to give up on defensive assets in favor of risky investment.
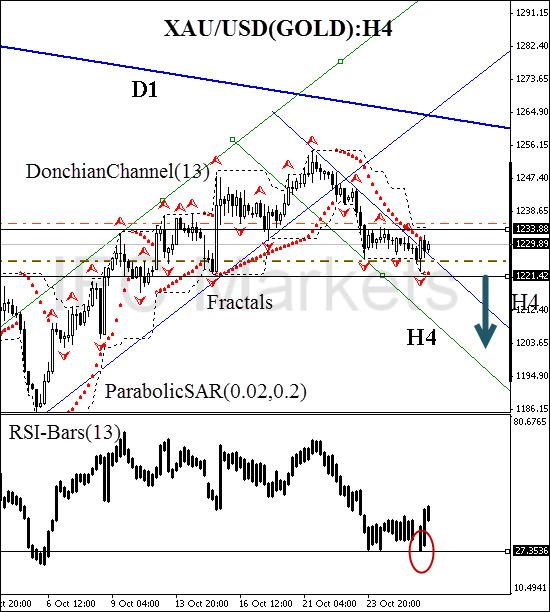
After position opening, Trailing Stop is to be moved after the Parabolic values, near the next fractal high. Thus, we are changing the probable profit/loss ratio to the breakeven point.
| Position | Sell |
| Sell stop | below 1221.42 |
| Stop loss | above 1233.88 |
- प्रमाण पत्र प्राप्त करेंe

ध्यान दें:
यह ओवरव्यू एक जानकारीपूर्ण और ट्यूटोरियल चरित्र है और मुफ्त में प्रकाशित किया जाता है. सभी डेटा, ओवरव्यू में शामिल, सार्वजनिक स्रोतों से प्राप्त कर रहे हैं, कम या ज्यादा विश्वसनीय रूप में मान्यता प्राप्त. अतिरिक्त, संकेत दिया जानकारी पूर्ण और सटीक है कि कोई गारंटी नहीं है. ओवरव्यू अद्यतन नहीं हैं . प्रत्येक ओवरव्यू में पूरी जानकारी, भी शामिल राय, इंडीकेटर्स , चार्ट और कुछ और, परिचय उद्देश्यों के लिए ही प्रदान की जाती है और वित्तीय सलाह या सिफारिश नहीं है. पूरे पाठ और उसके किसी भी हिस्से, और साथ हीचार्ट किसी भी संपत्ति के साथ एक सौदा करने के लिए एक प्रस्ताव के रूप में नहीं माना जा सकता है . IFC मार्केट्स और किसी भी परिस्थिति में अपने कर्मचारियों को किसी और के द्वारा की गई किसी कार्रवाई के दौरान लिए उत्तरदायी नहीं हैं या ओवरव्यू पढ़ने के बाद.
