- Analytics
- Technical Analysis
EUR/MXN Technical Analysis - EUR/MXN Trading: 2019-02-22
Bank of Mexico may cut the rate
In this review, we will consider the chart of the euro against the Mexican peso. Is there a possibility for the EURMXN to rise?
Such a movement occurs when the euro strengthens and the Mexican peso weakens. The current account balance of Mexico has been negative for already 30 years. In the 4th quarter of 2018, the deficit was $5.08 billion. In the Eurozone, the current account balance is positive at nearly 20 billion euros per month. Such dynamics can contribute to the strengthening of the European currency against the Mexican peso. An additional negative factor for the peso may be the rate cut of the Bank of Mexico (8.25%) at its next meeting on March 28, 2019. Market participants estimate the likelihood of such an event at the level of 70%. In addition, the Mexican government is going to increase spending to provide financial assistance to the state oil company Pemex in the amount of $3.6 billion. Investors fear that this will not be enough amid its debt in the amount of $106 billion. In turn, the main risk for the euro is the launch of the new money emission for the TLTRO program. The ECB may report any details at its next meeting on March 7, 2019.
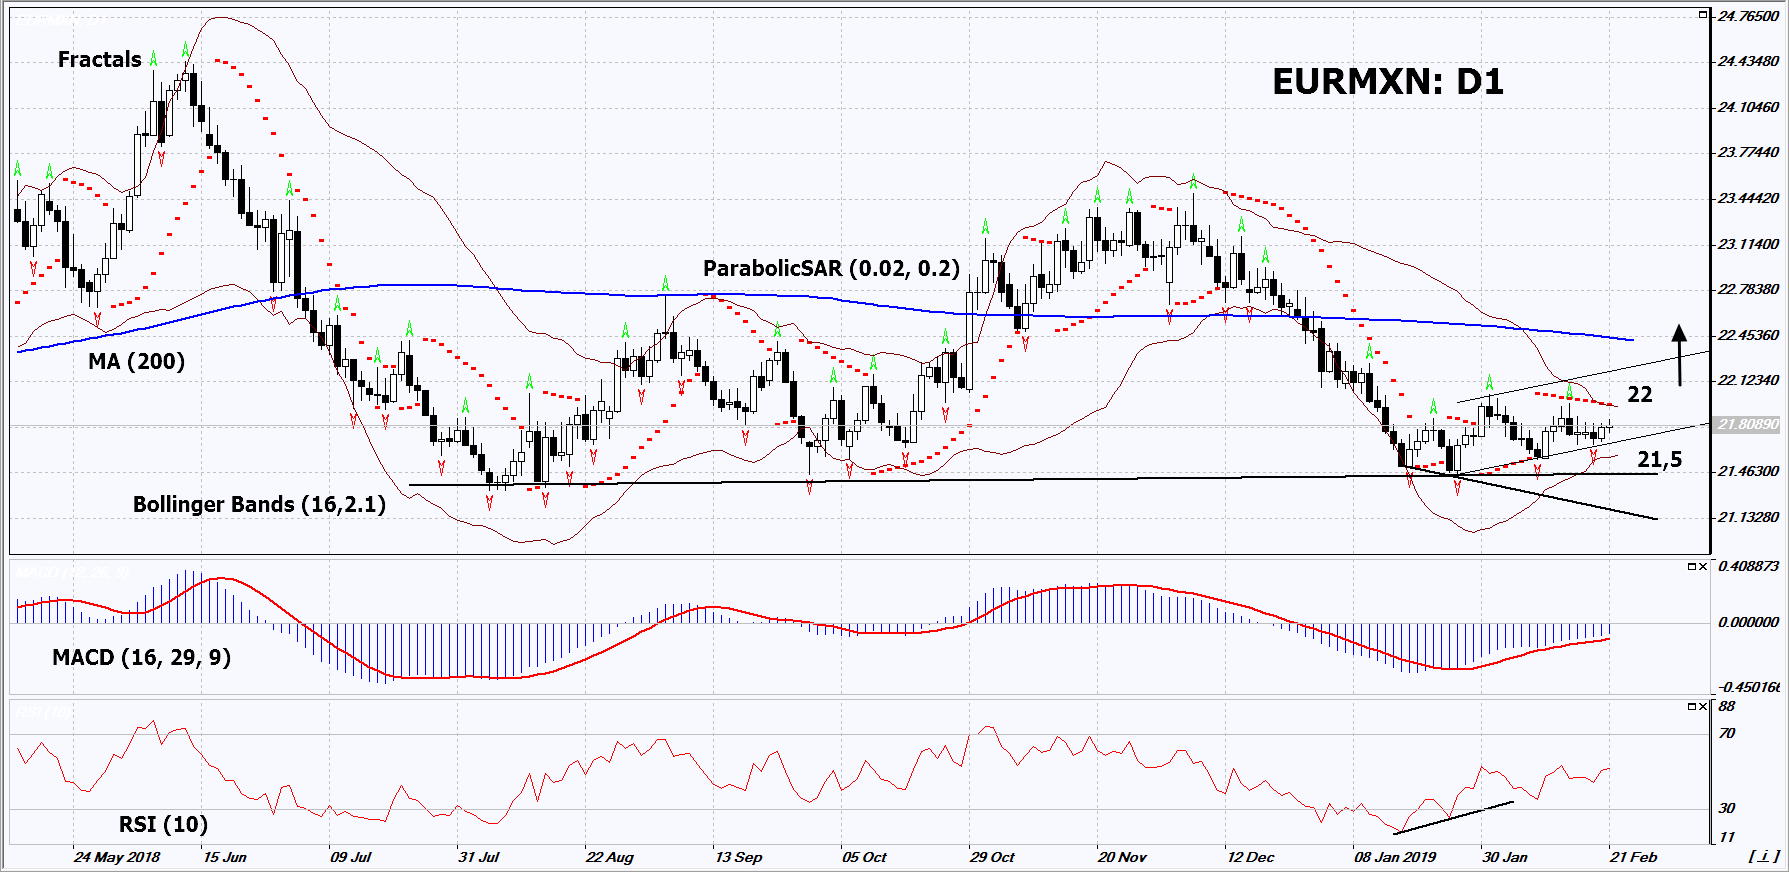
On the daily timeframe, EURMXN: D1 is correcting upwards within the wide neutral channel. A number of technical analysis indicators formed buy signals. The further price increase is possible in case of positive macroeconomic news in the EU and negative - in Mexico.
- The Parabolic Indicator gives a bearish signal. It can be used as an additional resistance level, which should be overcome before opening a buy position.
- The Bollinger bands have narrowed, which indicates low volatility. The lower Bollinger band is titled upward.
- The RSI indicator is above 50. It has formed a positive divergence.
- The MACD indicator gives a bullish signal.
The bullish momentum may develop in case EURMXN exceeds the upper Bollinger band, the Parabolic signal and its two last fractal highs at 22. This level may serve as an entry point. The initial stop loss may be placed below the two last fractal lows and the lower Bollinger band at 21.5. After opening the pending order, we shall move the stop to the next fractal low following the Bollinger and Parabolic signals. Thus, we are changing the potential profit/loss to the breakeven point. More risk-averse traders may switch to the 4-hour chart after the trade and place there a stop loss moving it in the direction of the trade. If the price meets the stop level (21.5) without reaching the order (22), we recommend to close the position: the market sustains internal changes that were not taken into account.
Summary of technical analysis
| Position | Buy |
| Buy stop | Above 22 |
| Stop loss | Below 21.5 |
- Get Certificate

Note:
This overview has an informative and tutorial character and is published for free. All the data, included in the overview, are received from public sources, recognized as more or less reliable. Moreover, there is no guarantee that the indicated information is full and precise. Overviews are not updated. The whole information in each overview, including opinion, indicators, charts and anything else, is provided only for familiarization purposes and is not financial advice or а recommendation. The whole text and its any part, as well as the charts cannot be considered as an offer to make a deal with any asset. IFC Markets and its employees under any circumstances are not liable for any action taken by someone else during or after reading the overview.
