- Analytics
- Technical Analysis
GBP/USD Technical Analysis - GBP/USD Trading: 2015-04-27
Trend continues
Let us consider the GBP/USD currency pair on the H4 chart. The price has breached the triangle's upper boundary and continued moving within the Donchian bullish channel. To be noted, ParabolicSAR historical values confirm the trend as well. At the moment we see the fluctuation near the historical resistance level at 1.51705. Market participants are supposed to wait until the bar closes above this mark.
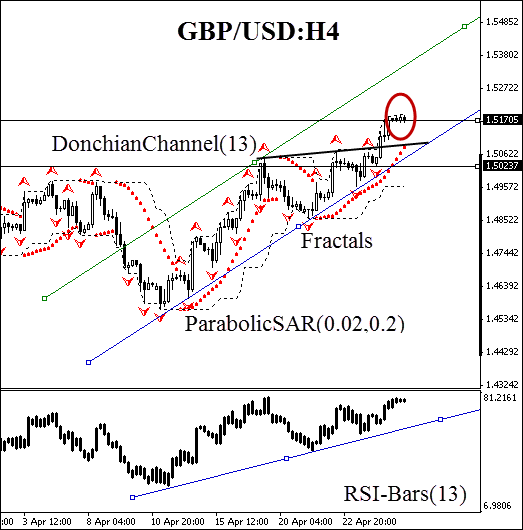
RSI-Bars supports our assumptions. The bars direction corresponds in general to the major trend on the chart. Conservative traders are recommended to wait until the H4 bar closes above 1.51705 (the price should consolidate over this mark) and to open a buy position immediately. Stop loss may be placed at the latest fractal support at 1.50237. This level is confirmed by Parabolic historical values and the trend channel support line. After pending order activation, the stop loss is to be moved every day near the next fractal high, following Parabolic signals. Thus, we are changing the probable profit/loss ratio to the breakeven point.
| Position | Buy |
| Buy stop | above 1.51705 |
| Stop loss | below 1.50237 |
- Get Certificate

Note:
This overview has an informative and tutorial character and is published for free. All the data, included in the overview, are received from public sources, recognized as more or less reliable. Moreover, there is no guarantee that the indicated information is full and precise. Overviews are not updated. The whole information in each overview, including opinion, indicators, charts and anything else, is provided only for familiarization purposes and is not financial advice or а recommendation. The whole text and its any part, as well as the charts cannot be considered as an offer to make a deal with any asset. IFC Markets and its employees under any circumstances are not liable for any action taken by someone else during or after reading the overview.
