- Analytics
- Technical Analysis
GBP/USD Technical Analysis - GBP/USD Trading: 2014-11-10
Sideways market and expectation
Today we do not expect the release of significant fundamental events that may affect the price movement of the most liquid instruments of the Forex market. It means that we would focus on the psychological sideways trend of the market, which may be indentified with the help of technical analysis. The first important data will come out on Wednesday: the Bank of England Governor Mark Carney’s speech. Up until that point the most probable price movement of the GBP/USD is in sideways market. However, it can be breached as investors expect the US dollar to strengthen further.
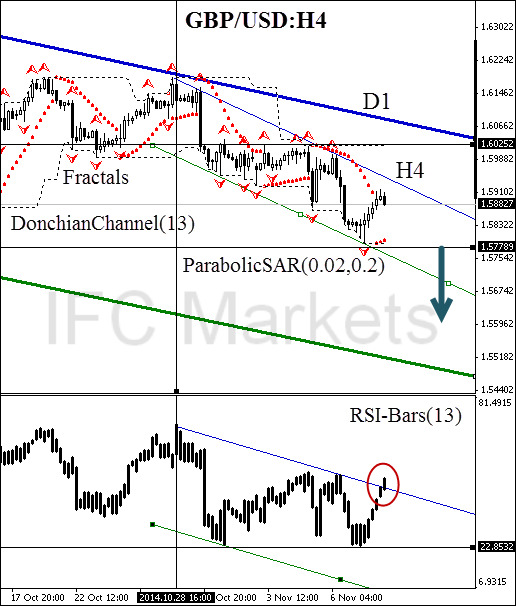
After position opening, Stop Loss is to be moved after the Parabolic values, near the next fractal high. Updating is enough to be done every day after a new Bill Williams fractal formation (5 candlesticks). Thus, we are changing the probable profit/loss ratio to the breakeven point.
| Position | Sell |
| Sell stop | below 1.57789 |
| Stop loss | above 1.60252 |
Dear traders. You can see the detailed report of the author’s account by clicking here.
- Get Certificate

Note:
This overview has an informative and tutorial character and is published for free. All the data, included in the overview, are received from public sources, recognized as more or less reliable. Moreover, there is no guarantee that the indicated information is full and precise. Overviews are not updated. The whole information in each overview, including opinion, indicators, charts and anything else, is provided only for familiarization purposes and is not financial advice or а recommendation. The whole text and its any part, as well as the charts cannot be considered as an offer to make a deal with any asset. IFC Markets and its employees under any circumstances are not liable for any action taken by someone else during or after reading the overview.
