- Analytics
- Technical Analysis
Hang Seng Technical Analysis - Hang Seng Trading: 2017-09-01
Positive economic data are bullish for Hong Kong stock index
Improving economic data indicate continued expansion of Hong Kong economy. Will HK 50 continue rising?
The expansion rate of Hong Kong economy exceeds growth rates of most developed countries. In the second quarter of 2017 the Hong Kong GDP expanded 3.8% over the same period of last year. The Q1 GDP was even higher - 4.3%. The acceleration in private consumption and investment offset the drag of negative external trade as government spending also rose slightly. Recent data indicate retail sales continued growing in July - 4.6% in annual terms, after 0.5% growth in June. Further positive developments included narrowing of balance of trade deficit for July and continued expansion in the private sector as evidenced by fourth consecutive increase in Nikkei Hong Kong Purchasing Managers’ Index above the 50-point threshold level. Improving economic reports point to continued expansion of Hong Kong economy.
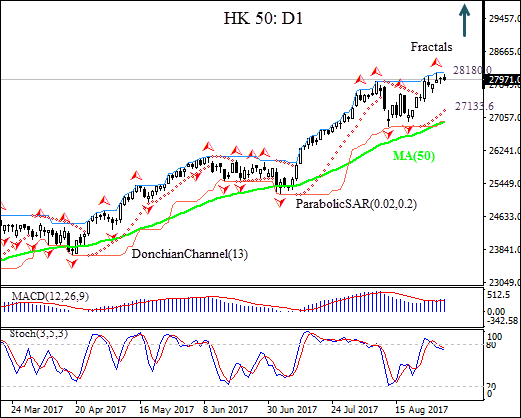
On the daily timeframe HK 50: D1 has been in upward trend since the beginning of 2017. The price has remained above the 50-day moving average MA(50) which has acted as a support during that period.
- The Donchian channel indicates uptrend yet: it is tilted up.
- The Parabolic indicator has formed a buy signal.
- The MACD indicator is bullish: it is above the signal line and the gap is widening.
- The stochastic oscillator is declining after falling back from the overbought zone.
We believe the bullish momentum will continue after the price closes above the upper boundary of Donchian channel at 28158.50. A price above this level can be used as an entry point for placing a pending order to buy. The stop loss can be placed below the Parabolic signal at 27133.6. After placing the order, the stop loss is to be moved every day to the next fractal low, following Parabolic signals. Thus, we are changing the probable profit/loss ratio to the breakeven point. If the price meets the stop loss level (27133.6) without reaching the order (28180.0), we recommend cancelling the position: the market has undergone internal changes which were not taken into account.
Technical Analysis Summary
| Position | Buy |
| Buy stop | Above 28180 |
| Stop loss | Below 27133.6 |
- Get Certificate

Note:
This overview has an informative and tutorial character and is published for free. All the data, included in the overview, are received from public sources, recognized as more or less reliable. Moreover, there is no guarantee that the indicated information is full and precise. Overviews are not updated. The whole information in each overview, including opinion, indicators, charts and anything else, is provided only for familiarization purposes and is not financial advice or а recommendation. The whole text and its any part, as well as the charts cannot be considered as an offer to make a deal with any asset. IFC Markets and its employees under any circumstances are not liable for any action taken by someone else during or after reading the overview.
