- Analytics
- Technical Analysis
WHEAT Technical Analysis - WHEAT Trading: 2019-12-13
Lower carryover estimates bullish for WHEAT
Lower wheat carryover estimates are bullish for wheat. Will the WHEAT rise?
Latest World Agriculture Supply and Demand Estimates (WASDE) report released by USDA on Tuesday cut wheat import estimates by 15 million bushels and raised exports by 25 million bushels. At the same time it lowered the carry over projection for wheat by 40 million bushels. These are all bullish developments for wheat. However recent reports projected increased wheat production in Europe and Russia, both major global producers. These are downside risk for wheat price. In Europe, a 14.3% increase compared to last year soft wheat harvest is projected, according to Coceral grain lobby. At the same time USDA forecast 0.7% increase for Russian wheat production in 2019/2, totaling 2.737 billion bushels. USDA projects also increased exports from Russia.
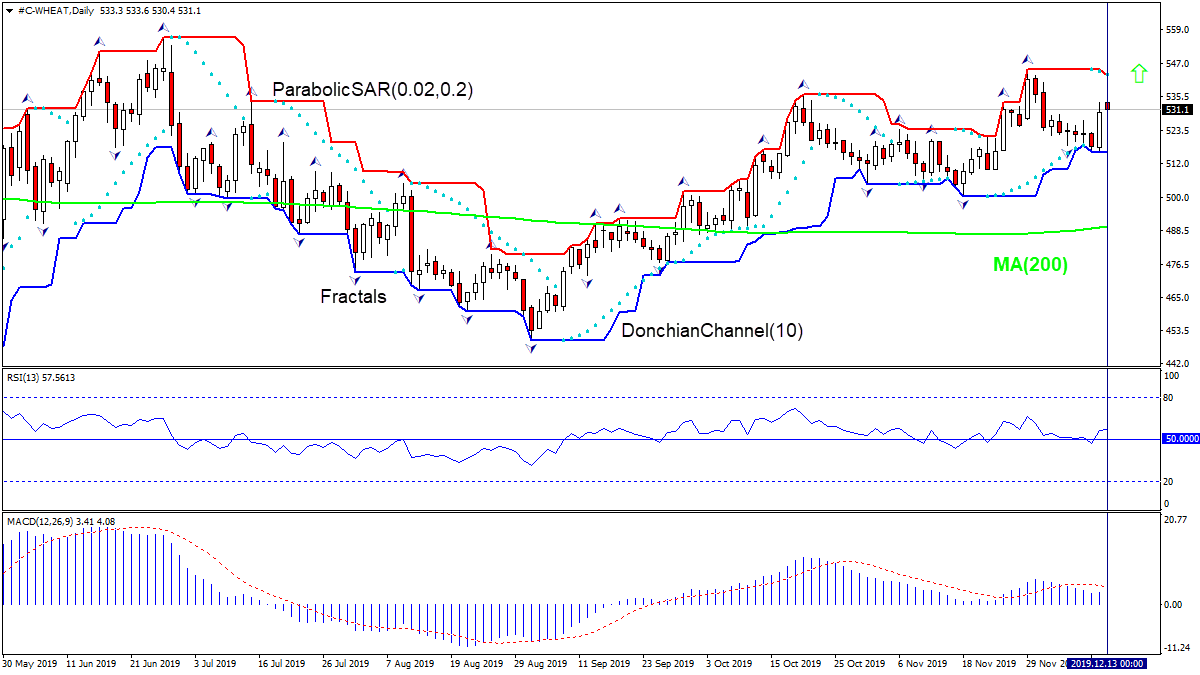
On the daily timeframe the WHEAT: D1 is retracing after hitting 5-month high in the end of November.
- The Parabolic indicator gives a sell signal.
- The Donchian channel indicates no trend yet.
- The MACD indicator gives a bullish signal: it is above the signal line and the gap is widening.
- The RSI oscillator is flat above the 50 level.
We believe the bullish momentum will continue after the price breaches above the upper boundary of Donchian channel at 542.8. This level can be used as an entry point for placing a pending order to buy. The stop loss can be placed below the lower Donchian boundary at 516. After placing the order, the stop loss is to be moved every day to the next fractal low, following Parabolic signals. Thus, we are changing the expected profit/loss ratio to the breakeven point. If the price meets the stop loss level (516) without reaching the order (542.8), we recommend cancelling the order: the market has undergone internal changes which were not taken into account.
Technical Analysis Summary
| Order | Buy |
| Buy stop | Above 542.8 |
| Stop loss | Below 516 |
- Get Certificate

Note:
This overview has an informative and tutorial character and is published for free. All the data, included in the overview, are received from public sources, recognized as more or less reliable. Moreover, there is no guarantee that the indicated information is full and precise. Overviews are not updated. The whole information in each overview, including opinion, indicators, charts and anything else, is provided only for familiarization purposes and is not financial advice or а recommendation. The whole text and its any part, as well as the charts cannot be considered as an offer to make a deal with any asset. IFC Markets and its employees under any circumstances are not liable for any action taken by someone else during or after reading the overview.
