- Analytics
- Technical Analysis
AUD Currency Index Technical Analysis - AUD Currency Index Trading: 2017-03-09
Current account balance in Australia turns negative for the first time
In this report we consider studying the personal composite instrument (PCI) Australian dollar index. It reflects its dynamics against the basket of major currencies. The index may decline if the Australian dollar becomes weaker.
The downward trend of this personal composite instrument usually reflects the problems in the Australian economy. On Tuesday March 2017 the Reserve Bank of Australia (RBA) left the interest rate unchanged at its historical low of 1.5%. Meanwhile, investors point at two economic problems^ deflation risk and the real estate bubble. To solve the former the rate shall be cut while to solve the latter one rate hike is needed. Given high RBA rates, the index of Australian dollar hit a fresh 3-year high last week. Now it is correcting down. Given the high expectations of the Fed rate hike, the Australian currency becomes less appealing for investors. In Q4 2016 the current account balance unexpectedly turned negative for the first time since 1959. The trade balance surplus was twice lower in January than anticipated. This may further support the negative current account balance in Australia in Q1 2017. The additional negative for Australian dollar may be the slowdown of Chinese economy. China is the main importer of Australian commodities and accounts for more than 25% of Australia’s exports. Previously the Chinese GDP for the current year was lowered to 6.5% from 6.7% in 2016. On Wednesday March 8 the trade balance for February came out in China being negative for the first time in recent 3 years. Early on Friday morning, on March 10, the Australian real estate market data and Chinese new loans data will come out. In the evening the US labour market data is expected. This economic data may affect the Australian dollar.
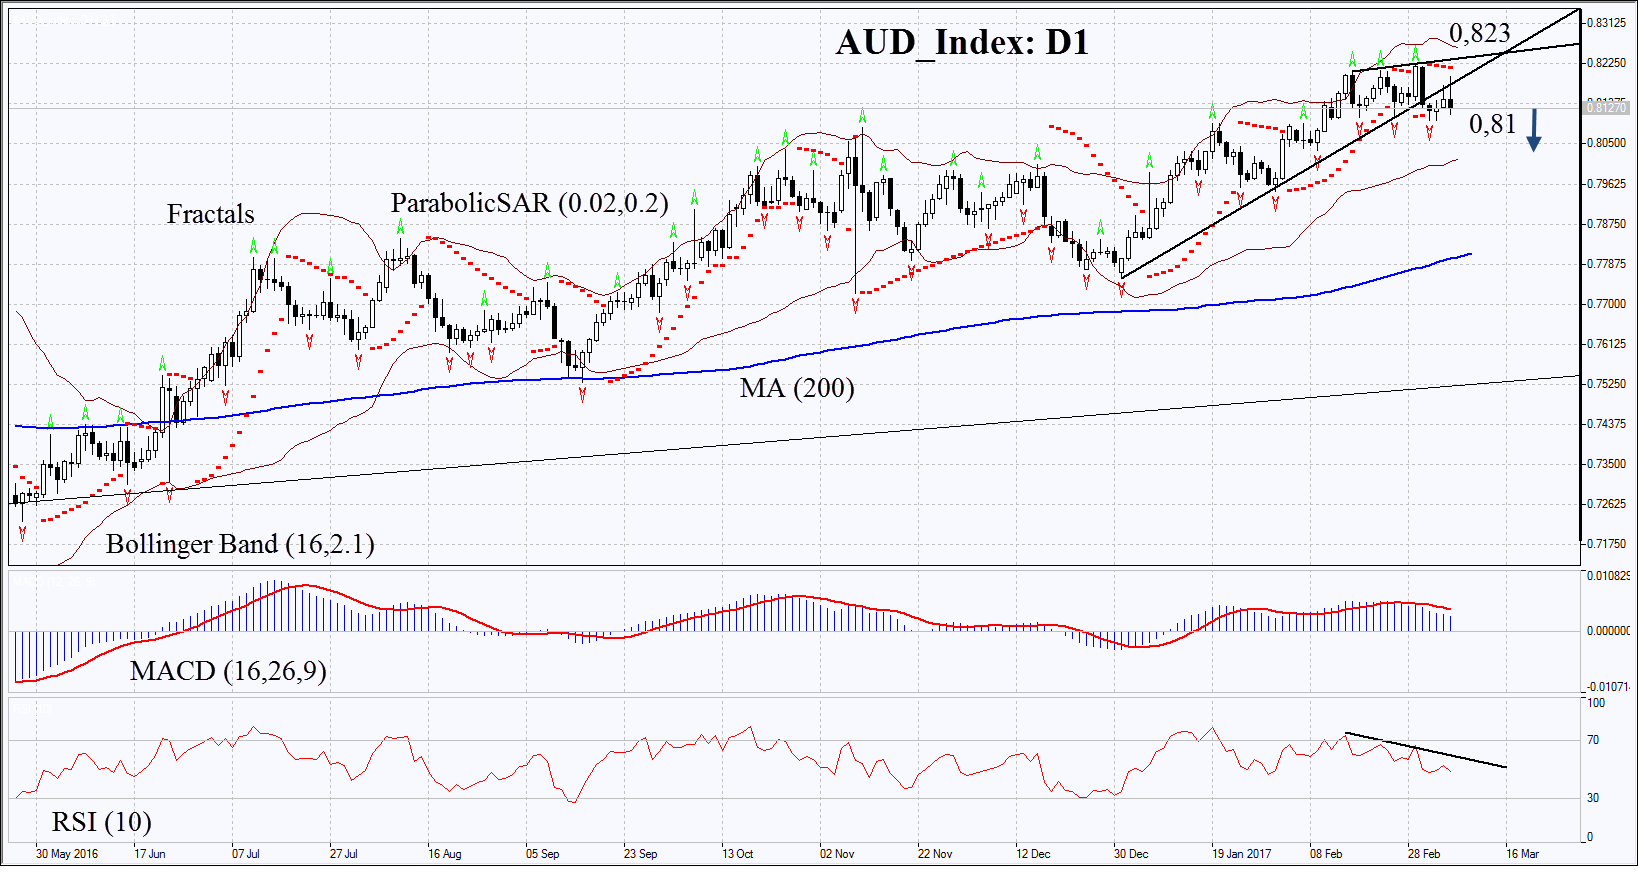
On the daily chart AUD_Index: D1 has previously hit a 3-year high. Now it is correcting down and has broken through the support of the rising trend. Its further decline is possible in case of the Fed rate hike and negative economic data in Australia and China.
- The Parabolic indicator gives bearish signal.
- The Bollinger bands are moving sideways which means normal volatility.
- The RSI is below 50. It has formed negative divergence.
- The MACD gives bearish signals.
The bearish momentum may develop in case AUD_Index falls below the last fractal low at 0.81. This level may serve the point of entry. The initial stop-loss may be placed above the last fractal high, the 3-year high and the Parabolic signal at 0.823. Having opened the pending order we shall move the stop to the next fractal high following the Parabolic and Bollinger signals. Thus, we are changing the probable profit/loss ratio to the breakeven point. The most risk-averse traders may switch to the 4-hour chart after the trade and place there a stop-loss moving it in the direction of the trade. If the price meets the stop-loss level at 0.823 without reaching the order at 0.81, we recommend cancelling the position: the market sustains internal changes which were not taken into account.
Summary of technical analysis
| Position | Sell |
| Sell stop | below 0.81 |
| Stop loss | above 0.823 |
Explore our
Trading Conditions
- Spreads from 0.0 pip
- 30,000+ Trading Instruments
- Stop Out Level - Only 10%
Ready to Trade?
Open Account Note:
This overview has an informative and tutorial character and is published for free. All the data, included in the overview, are received from public sources, recognized as more or less reliable. Moreover, there is no guarantee that the indicated information is full and precise. Overviews are not updated. The whole information in each overview, including opinion, indicators, charts and anything else, is provided only for familiarization purposes and is not financial advice or а recommendation. The whole text and its any part, as well as the charts cannot be considered as an offer to make a deal with any asset. IFC Markets and its employees under any circumstances are not liable for any action taken by someone else during or after reading the overview.
