- Analytics
- Technical Analysis
AUD/USD Technical Analysis - AUD/USD Trading: 2016-11-17
Employment change in Australia falls short of expectations
Since November 8, 2016 when US presidential elections took place, Australian dollar slumped 3.5%. Weak employment data for October came out in Australia on Thursday. Will AUDUSD continue falling?
Unemployment rate in Australia remained the same in October as in September being at 3-year low of 5.6%. But the Employment change was just +9.8k instead of expected +20k while the September data were revised down to -29k which signifies quite a substantial contraction in labour market. Reserve bank of Australia cut the base rate this May and August to the current 1.5%. The chances for its further cuts are at about 20%. In theory, chances may rise if weak current account and external trade data come out for Q3 2016. They are to come out on December 6 and 8. Today the Fed President Janel Yellen speaks on economy. Investors expect she may express her concerns with severe strengthening of US dollar. If this is not the case, AUDUSD will more possibly edge up.
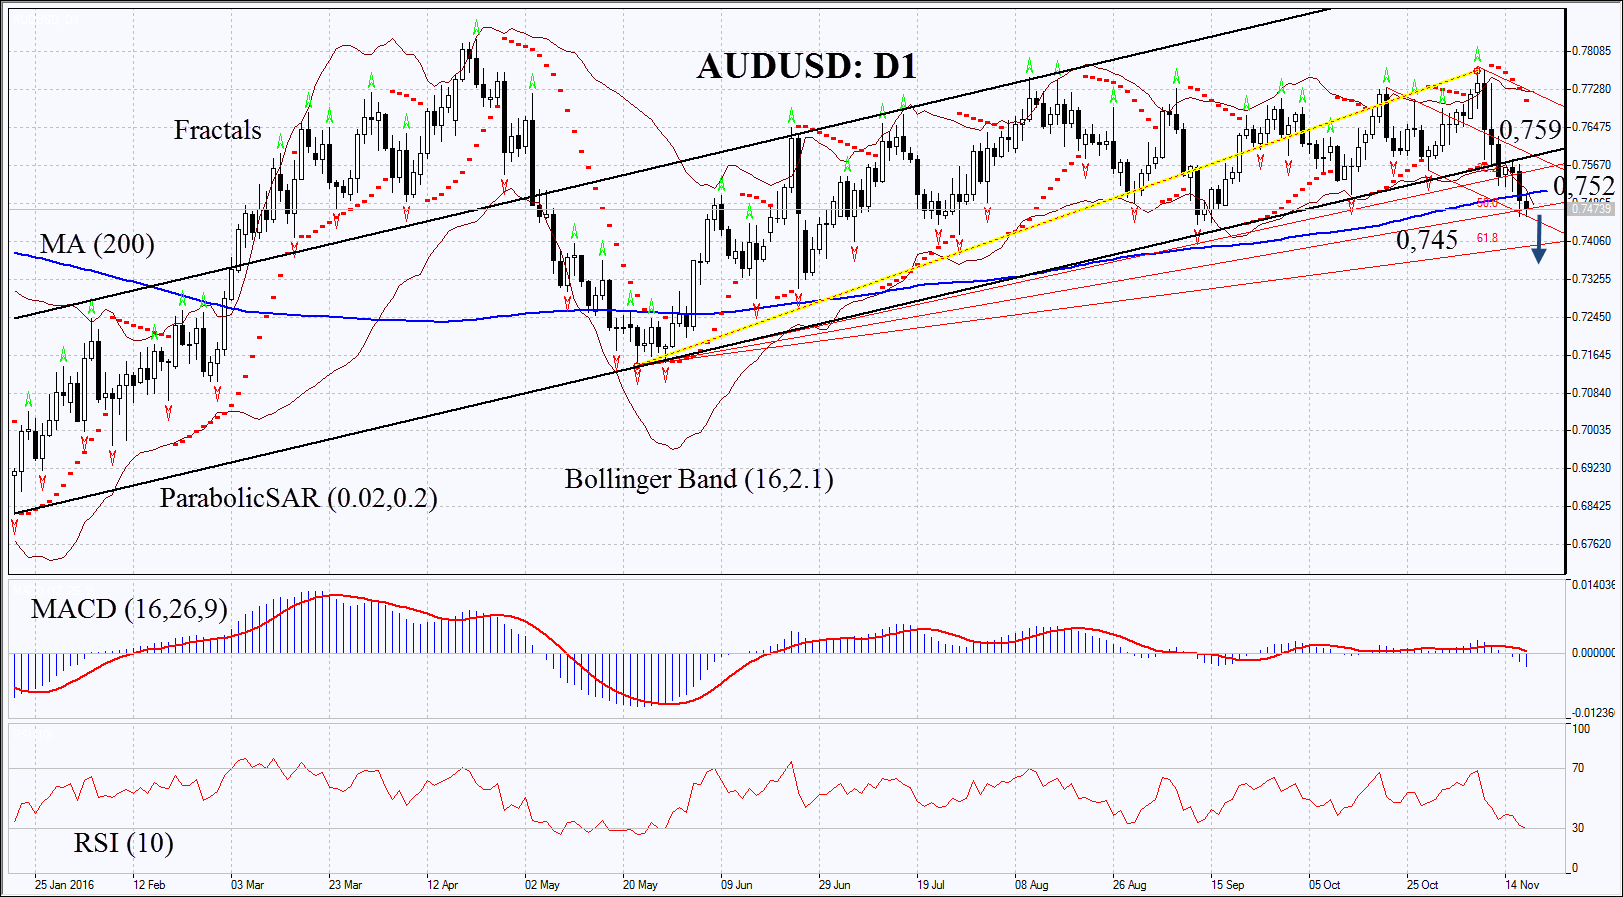
On the daily chart AUDUSD: D1 broke down through support of the rising channel and is correcting down. It has fallen below its 200-day moving average. Further decline is possible in case of worse economic data in Australia and in case of lower global prices on mineral resources, metals and agricultural production.
- Parabolic gives bearish signal.
- Bollinger bands have widened which means higher volatility. They are tilted downward.
- RSI has reached the oversold zone, no divergence.
- MACD gives bearish signals.
The bearish momentum may develop in case Australian dollar falls below the Wednesday low (previous candle), Gann lines and lower Andrews' Pitchfork line at 0.745. This level may serve the point of entry. The initial stop-loss may be placed above the 200-day moving average and in case AUDUSD returns to the previous rising channel at 0.752 or 0.759. Having opened the pending order we shall move the stop to the next fractal high following the Parabolic and Bollinger signals. Thus, we are changing the probable profit/loss ratio to the breakeven point. The most risk-averse traders may switch to the 4-hour chart after the trade and place there a stop-loss moving it in the direction of the trade. If the price meets the stop-loss level at 0.752 or 0.759 without reaching the order at 0.745, we recommend cancelling the position: the market sustains internal changes which were not taken into account.
Summary of technical analysis
| Position | Sell |
| Sell stop | below 0.745 |
| Stop loss | above 0.752 or 0.759 |
Explore our
Trading Conditions
- Spreads from 0.0 pip
- 30,000+ Trading Instruments
- Stop Out Level - Only 10%
Ready to Trade?
Open Account Note:
This overview has an informative and tutorial character and is published for free. All the data, included in the overview, are received from public sources, recognized as more or less reliable. Moreover, there is no guarantee that the indicated information is full and precise. Overviews are not updated. The whole information in each overview, including opinion, indicators, charts and anything else, is provided only for familiarization purposes and is not financial advice or а recommendation. The whole text and its any part, as well as the charts cannot be considered as an offer to make a deal with any asset. IFC Markets and its employees under any circumstances are not liable for any action taken by someone else during or after reading the overview.
