- Analytics
- Technical Analysis
AUD/USD Technical Analysis - AUD/USD Trading: 2019-04-25
Weaker Australian inflation is bearish for AUDUSD
Inflation slowed in Australia in the first three months of the year. Will the AUDUSD continue declining?
Latest economic data from Australia after March labor market report were soft. While an uptick in March unemployment was mainly due to increased labor force participation, first quarter inflation was weaker than expected. Consumer prices were flat over quarter in the first three months of the year, the softest outcome since early 2016. Meanwhile inflation in the first three months declined to 1.5% over the same period a year ago after 1.8% gain in the last three months of 2018. Inflation remains well short of the Reserve Bank of Australia's target of 2%-3% on year, raising pressure on policy makers to shift policy stance from neutral at RBA’s April 2 policy meeting to easing at its coming meeting in May. Weaker inflation is bearish for AUDUSD.
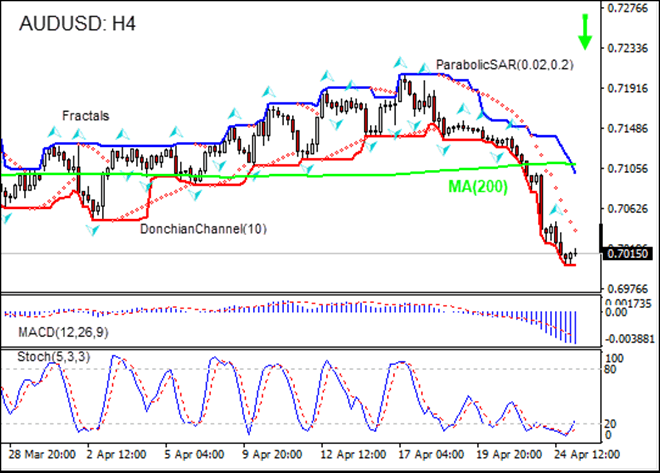
On the 4-hour timeframe the AUDUSD: H4 is retracing after hitting two-month high in mid-April. It has fallen below the 200-day moving average MA(200), which is also bearish.
- The Parabolic indicator gives a sell signal.
- The Donchian channel indicates downtrend: it is tilted down.
- The MACD indicator gives a bearish signal: it is below the signal line and the gap is widening.
- The Stochastic oscillator is rising from the oversold zone.
We believe the bearish momentum will continue after the price breaches below lower boundary of Donchian channel at 0.7001. This level can be used as an entry point for placing a pending order to sell. The stop loss can be placed above the upper Donchian boundary at 0.7100. After placing the order, the stop loss is to be moved every day to the next fractal high, following Parabolic signals. Thus, we are changing the expected profit/loss ratio to the breakeven point. If the price meets the stop loss level (0.7100) without reaching the order (0.7001), we recommend cancelling the order: the market has undergone internal changes which were not taken into account.
Technical Analysis Summary
| Position | Sell |
| Sell stop | Below 0.7001 |
| Stop loss | Above 0.7100 |
Explore our
Trading Conditions
- Spreads from 0.0 pip
- 30,000+ Trading Instruments
- Stop Out Level - Only 10%
Ready to Trade?
Open Account Note:
This overview has an informative and tutorial character and is published for free. All the data, included in the overview, are received from public sources, recognized as more or less reliable. Moreover, there is no guarantee that the indicated information is full and precise. Overviews are not updated. The whole information in each overview, including opinion, indicators, charts and anything else, is provided only for familiarization purposes and is not financial advice or а recommendation. The whole text and its any part, as well as the charts cannot be considered as an offer to make a deal with any asset. IFC Markets and its employees under any circumstances are not liable for any action taken by someone else during or after reading the overview.
