- Analytics
- Technical Analysis
Cocoa Technical Analysis - Cocoa Trading: 2018-04-09
Drought has not significantly affected the harvest in West Africa
Cocoa prices are correcting down from their 1.5-year high. Our previous recommendation on this asset is no longer relevant, as the price has reached the level of order cancellation. Let us try to renew it. Will cocoa prices fall?
Since December last year, they have increased without any special corrections by almost one and a half times because of the drought in West Africa. 65% of the world cocoa is produced only in three West African countries: Cote d'Ivoire (36%), Ghana (24%) and Cameroon (5%). According to Coffee and Cocoa Council, from October 1, 2017 to March 25, 2018, 1.486 million tons of cocoa were delivered to the ports of the main producer Côte d'Ivoire, which is only by 1% less than in the same period of previous years. Meanwhile, in the current season, the average market price of cocoa is by about 20% higher. The government of Côte d'Ivoire expects that despite the drought, at the beginning of the 2017/18 agricultural season, the total cocoa crop will be 2 million tons, which is close to the record level of the previous season.
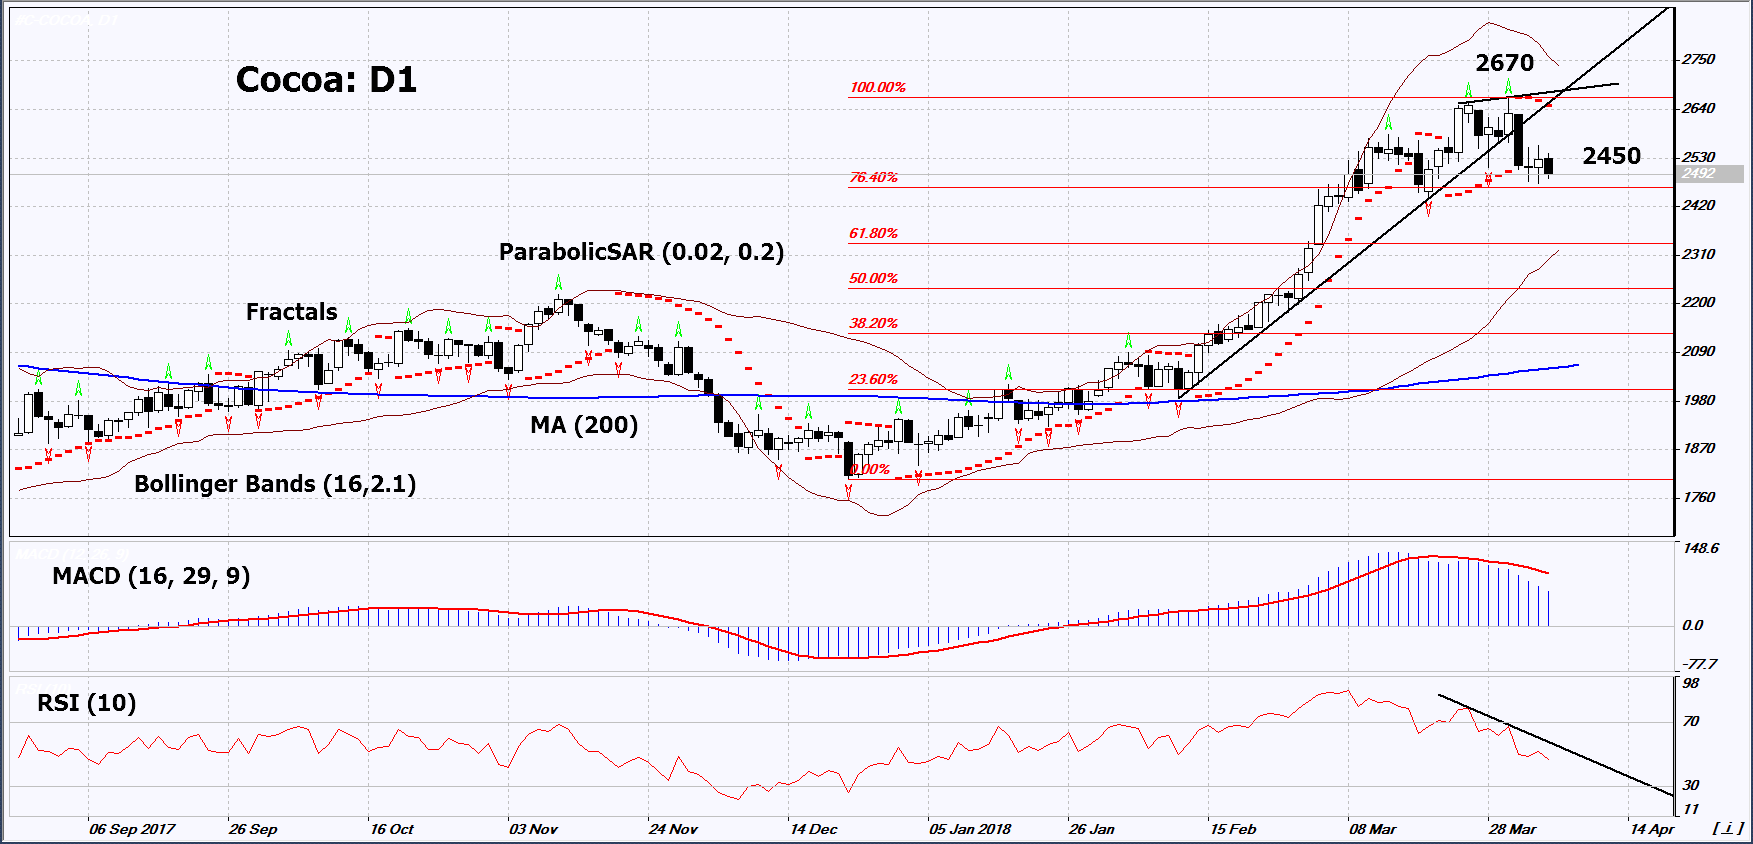
On the daily timeframe, Cocoa: D1 breached below the support line of the rising trend. The continuation of the downward correction is possible in case of increased forecasts of the harvest in the countries of West Africa.
- The Parabolic indicator gives a bearish signal.
- The Bollinger bands have widened, which indicates high volatility.
- The RSI indicator is below 50. It has formed a negative divergence.
- The MACD indicator gives a bearish signal.
The bearish momentum may develop in case Cocoa falls below the last low and the first level of Fibonacci at 2450. This level may serve as an entry point. The initial stop loss may be placed above the last fractal high, the maximum for a year and a half and the Parabolic signal at 2670. After opening the pending order, we shall move the stop to the next fractal high following the Bollinger and Parabolic signals. Thus, we are changing the potential profit/loss to the breakeven point. More risk-averse traders may switch to the 4-hour chart after the trade and place there a stop loss moving it in the direction of the trade. If the price meets the stop level at 2670 without reaching the order at 2450, we recommend cancelling the position: the market sustains internal changes that were not taken into account.
Summary of technical analysis
| Position | Sell |
| Sell stop | Below 2450 |
| Stop loss | Above 2670 |
- Get Certificate

Note:
This overview has an informative and tutorial character and is published for free. All the data, included in the overview, are received from public sources, recognized as more or less reliable. Moreover, there is no guarantee that the indicated information is full and precise. Overviews are not updated. The whole information in each overview, including opinion, indicators, charts and anything else, is provided only for familiarization purposes and is not financial advice or а recommendation. The whole text and its any part, as well as the charts cannot be considered as an offer to make a deal with any asset. IFC Markets and its employees under any circumstances are not liable for any action taken by someone else during or after reading the overview.
