- Analytics
- Technical Analysis
COPPER Technical Analysis - COPPER Trading: 2017-03-07
Chinese company plans to increase copper production
Chinese Jiangxi Copper is planning to increase copper production in 2017 to 1.36mln tonnes from 1.2mln tonnes a year ago. Will copper prices continue falling?
Global copper production will rise in 2017 by 500 thousand tonnes compared to the 2016, according to the previous forecasts, and will reach 23.3mln tonnes. Jiangxi Copper is planning to produce the additional 160 thousand tonnes of copper to affect the dynamics of the global market. The company management explains its plans by expectations that national demand for copper rises 6% this year. It added 5.8% last year. China consumes around half of global copper production. Meanwhile, the Chinese officials have lowered the GDP forecast to 6.5% this year from 6.7% in 2016. Theoretically, the internal demand for copper may slow down together with GDP growth. The additional factor for price increase may be the end of strike at the world major copper mine Escondida which is situated in Chile. The strike began on February 9, 2017. The mine accounts for 5% of global copper production. We believe that in recent future the economic data from China may weigh on copper prices: the trade balance for February and the industrial production for January. They will come out on March 8 and 14, respectively. In our opinion, the tentative outlook is negative for the Chinese economy.
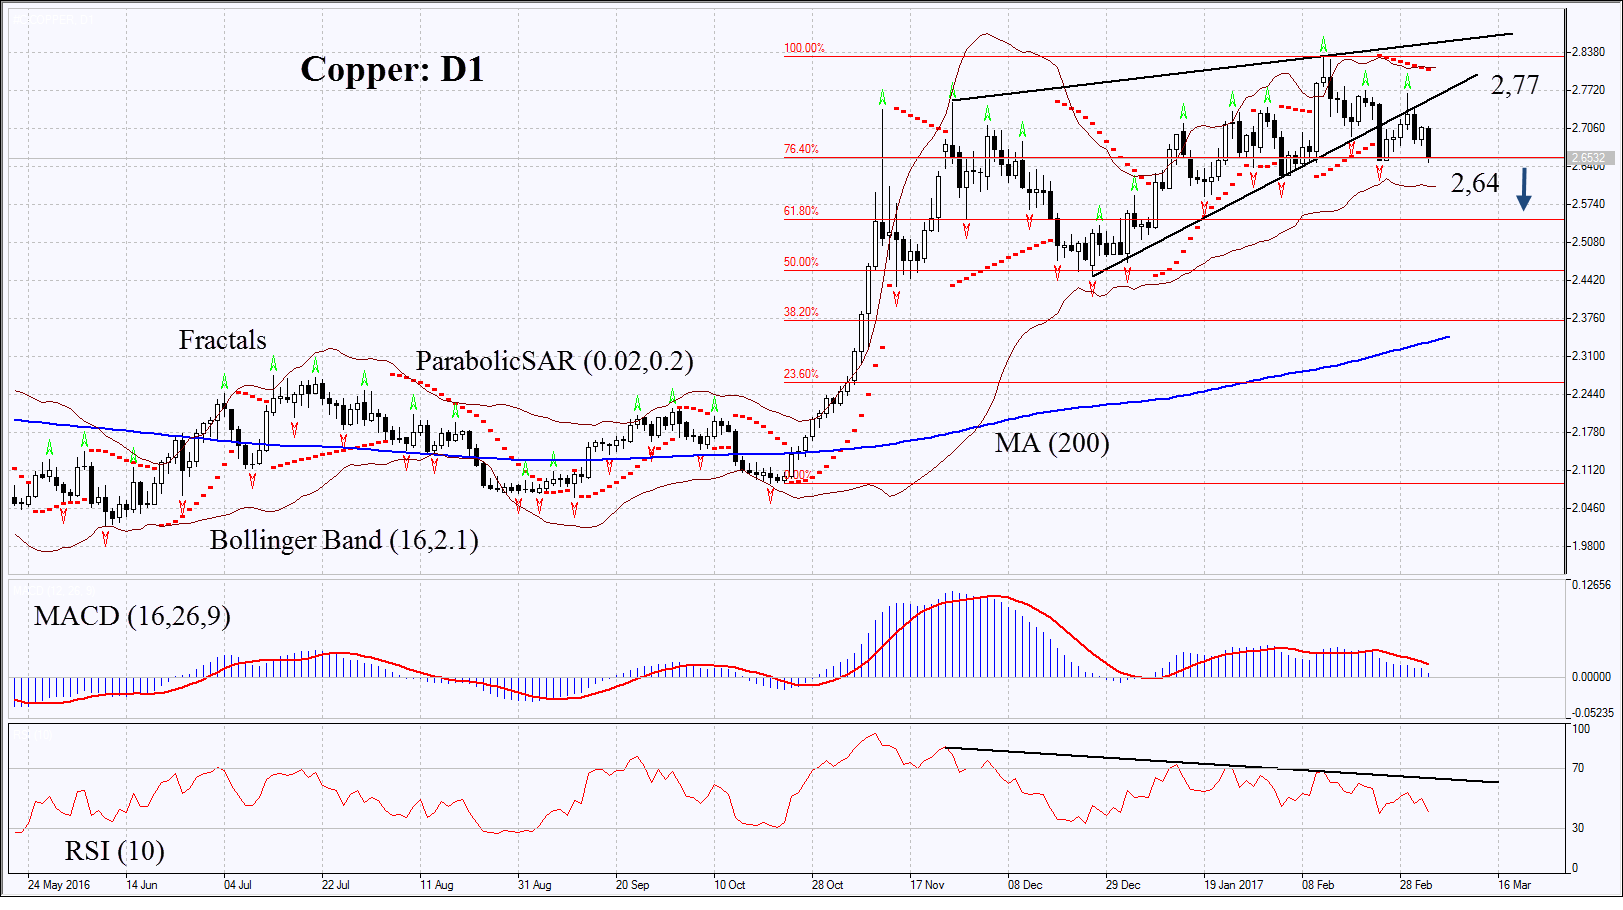
On the daily chart Copper: D1 left the rising trend to move downwards. Its further price decline is possible in case of negative economic data in China and recovered production in Chile.
- The Parabolic indicator gives bearish signal.
- The Bollinger bands have narrowed which means lower volatility. They are tilted downward.
- The RSI is below 50. No divergence.
- The MACD is giving bearish signals.
The bearish momentum may develop in case Copper falls below the latest low and the fractal low at 2.64. This level may serve the point of entry. The initial stop-loss may be placed above the last fractal low at 2.77. Having opened the pending order we shall move the stop to the next fractal high following the Parabolic and Bollinger signals. Thus, we are changing the probable profit/loss ratio to the breakeven point. The most risk-averse traders may switch to the 4-hour chart after the trade and place there a stop-loss moving it in the direction of the trade. If the price meets the stop-loss level at 2.77 without reaching the order at 2.64, we recommend cancelling the position: the market sustains internal changes which were not taken into account.
Summary of technical analysis
| Position | Sell |
| Sell stop | below 2.64 |
| Stop loss | above 2.77 |
- Get Certificate

Note:
This overview has an informative and tutorial character and is published for free. All the data, included in the overview, are received from public sources, recognized as more or less reliable. Moreover, there is no guarantee that the indicated information is full and precise. Overviews are not updated. The whole information in each overview, including opinion, indicators, charts and anything else, is provided only for familiarization purposes and is not financial advice or а recommendation. The whole text and its any part, as well as the charts cannot be considered as an offer to make a deal with any asset. IFC Markets and its employees under any circumstances are not liable for any action taken by someone else during or after reading the overview.
