- Analytics
- Technical Analysis
COPPER Technical Analysis - COPPER Trading: 2019-04-16
Traders are getting ready for the publication of important statistics in China
Last week positive macroeconomic data was published in China. Will the Copper quotations grow?
China consumes about half of all copper produced in the world. According to the Chinese General Administration of Customs, in March of this year, 1.77 million tons of copper ore were imported into the country, which is 10.6% more than the same month in 2018. Generally the data on Chinese foreign trade for March 2019 was very positive. The trade surplus was $ 32.6 billion, which is much better than the preliminary forecast of $ 5.7 billion. Another positive factor was the increase in lending in RMB in March to 1.69 trillion yuan, with a forecast of 1.2 trillion. yuan This Wednesday, on April 17, the data on China's industrial production and retail sales for March will be published early in the morning, also will be published important GDP data for the first quarter of this year. If the data turns out to be positive, it may increase the demand for copper. According to forecasts, Chinese GDP growth will slow to a 27-year low and will be + 6.3%. For the entire 2018 the Chinese economy grew by 6.6%. According to the government's forecast, in 2019 its growth will slow down a bit and will be 6.2%.
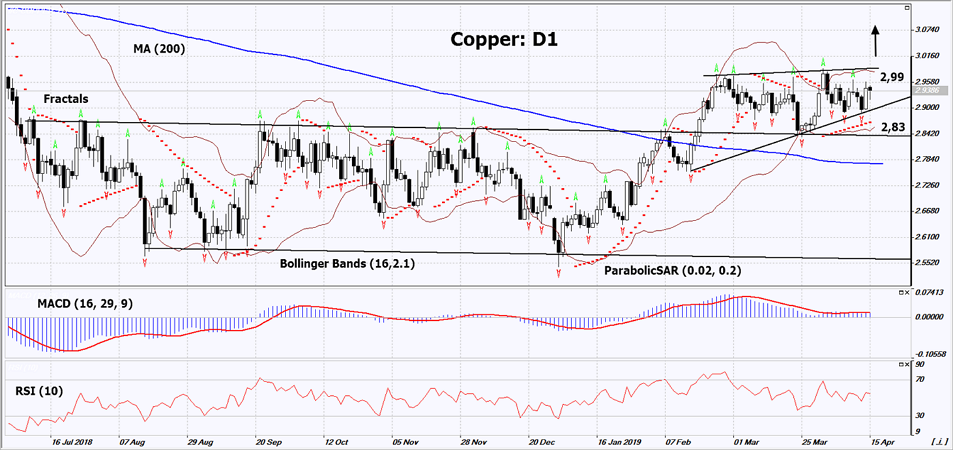
On the daily timeframe, Copper: D1 broke up the resistance line of the medium-term neutral trend and forms a new uptrend in the form of a triangle. Various technical analysis indicators show an uptrend. Further growth of quotations is possible in case of publication of positive macroeconomic statistics in China.
- The Parabolic Indicator demonstrates and uptrend signal.
- The Bollinger Bands narrowed,which indicates the volatility decrease. The bottom line of Bollinger has a slope up.
- The RSI Indicator is above 50. No divergences observed.
- The MACD Indicator shows an uptrend signal.
The bullish momentum may develop in case if Copper will exceed the last two upper fractals, a maximum since June 2018 and the upper Bollinger line: 2.99. This level may serve as an entry point. The initial stop loss may be placed below the last 4 lower fractals, the Parabolic signal and the bottom Bollinger line: 2.83. After opening the pending order, we shall move the stop following the Bollinger Bands and Parabolic to the next fractal minimum.Thus, we are changing the potential profit/loss to the breakeven point. More risk-averse traders may switch to the 4-hour chart after the trade and place there a stop loss moving it in the direction of the trade. If the price meets the stop level (2,83), without reaching the order (2,99), we recommend to close the position: the market sustains internal changes that were not taken into account.
Technical Analysis Summary
| Position | Buy |
| Buy stop | Above 2,99 |
| Stop loss | Below 2,83 |
Explore our
Trading Conditions
- Spreads from 0.0 pip
- 30,000+ Trading Instruments
- Stop Out Level - Only 10%
Ready to Trade?
Open Account Note:
This overview has an informative and tutorial character and is published for free. All the data, included in the overview, are received from public sources, recognized as more or less reliable. Moreover, there is no guarantee that the indicated information is full and precise. Overviews are not updated. The whole information in each overview, including opinion, indicators, charts and anything else, is provided only for familiarization purposes and is not financial advice or а recommendation. The whole text and its any part, as well as the charts cannot be considered as an offer to make a deal with any asset. IFC Markets and its employees under any circumstances are not liable for any action taken by someone else during or after reading the overview.
