- Analytics
- Technical Analysis
Germany 30 Technical Analysis - Germany 30 Trading: 2016-01-28
ECB to cut deposit rate is March?
The Germany’s DAX 30 stock market index is edging up amid strong macroeconomic and corporate data. Additional positive was Mario Draghi’s comment that ECB may expand its monetary stimulus programme on its meeting on January 21, 2016. The current volume of QE programme in Europe is 60bn euros a month with the total planned volume of 1.1trn euros. The majority of market players believe the ECB will cut the deposit rate on its next meeting on March 10, 2016. The chances of QE expansion are estimated as 50 to 50. Will the DAX 30 index continue edging up?
The Germany’s GDP rose 1.8% in Q3 outperforming the EU GDP growth of 1.6%. Meanwhile, the positive Germany’s trade balance was 19.7bn euros while in Eurozone – 23.7bn euros. Germany accounts almost for 83% of the EU foreign trade surplus. For this reason the German companies look forward with optimism. On Tuesday the biggest in Europe industrial group Siemens revised up its financial outlook for this year with its shares gaining 8.6% on this news. DAX has fallen about 20% from its axis hit in April 2015 and about 10% since New Year. Let’s consider the case of the continued upward retracement. The January inflation will come out on January 28, the December retail sales on January 29 and the January unemployment on February 2. These data may affect the share prices.
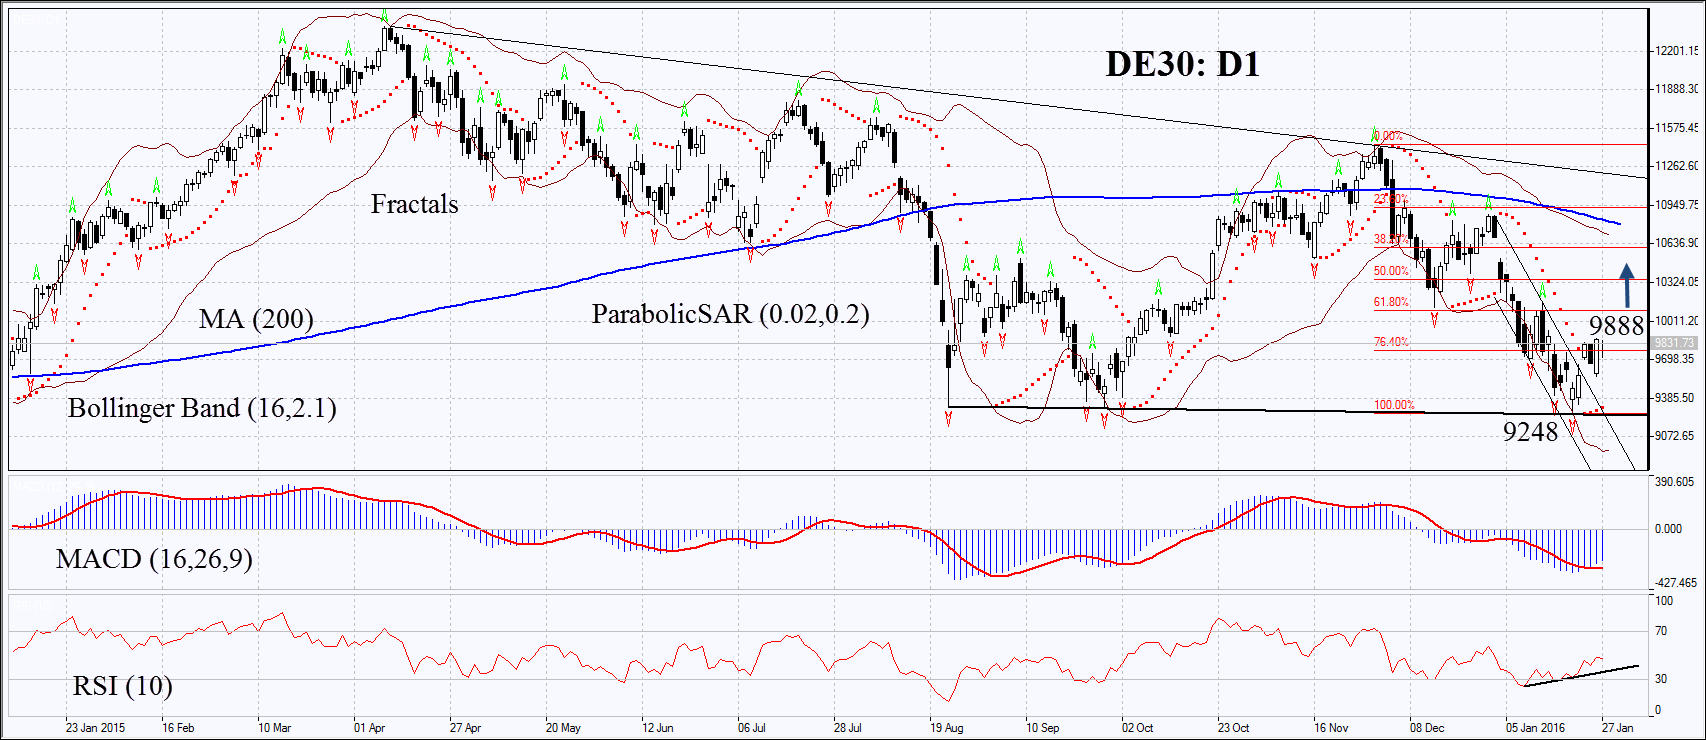
On the daily chart DE30: D1 failed to break down the support of the neutral trend and started retracing upwards. In recent days is has closed the gap and is traded slightly above the 76.4% Fibonacci retracement. The Parabolic and MACD indicators give buy signals. RSI has formed the positive divergence and is below 50. The Bollinger bands have widened a lot which means higher volatility and supports the sideways movement. The bullish momentum may develop in case DE30 surpasses the Tuesday high and the 2nd Parabolic signal at 9888. This level may serve the point of entry. The initial risk-limit may be placed below the Parabolic signal and the last fractal low at 9248. Having opened the pending order we shall move the stop to the next fractal low following the Parabolic and Bollinger signals. Thus, we are changing the probable profit/loss ratio to the breakeven point. The most risk-averse traders may switch to the 4-hour chart after the trade and place there a stop-loss moving it in the direction of the trade. If the price meets the stop-loss level at 9248 without reaching the order at 9888, we recommend cancelling the position: the market sustains internal changes which were not taken into account.
| Position | Buy |
| Buy stop | above 9888 |
| Stop loss | below 9248 |
- Get Certificate

Note:
This overview has an informative and tutorial character and is published for free. All the data, included in the overview, are received from public sources, recognized as more or less reliable. Moreover, there is no guarantee that the indicated information is full and precise. Overviews are not updated. The whole information in each overview, including opinion, indicators, charts and anything else, is provided only for familiarization purposes and is not financial advice or а recommendation. The whole text and its any part, as well as the charts cannot be considered as an offer to make a deal with any asset. IFC Markets and its employees under any circumstances are not liable for any action taken by someone else during or after reading the overview.
