- Analytics
- Technical Analysis
EU 50 50 Technical Analysis - EU 50 50 Trading: 2020-01-13
The Eurozone economy shows the first signs of recession
There is a decrease in industrial production in the Eurozone and Germany. Is the correction of the EU50 possible?
The share of industrial companies in this index is 40%. The German Factory Orders indicator fell by 6.5% in November, and the German Industrial Production - by 2.6%. The pan-European Industrial Production indicator has been declining since February 2019. The EU Business Climate indicator fell to the minimum since August 2013. Meanwhile, the EU50 stock index has increased by almost 10% over the past 3 months. The reporting season of European companies begins on January 17, which may affect its dynamics.
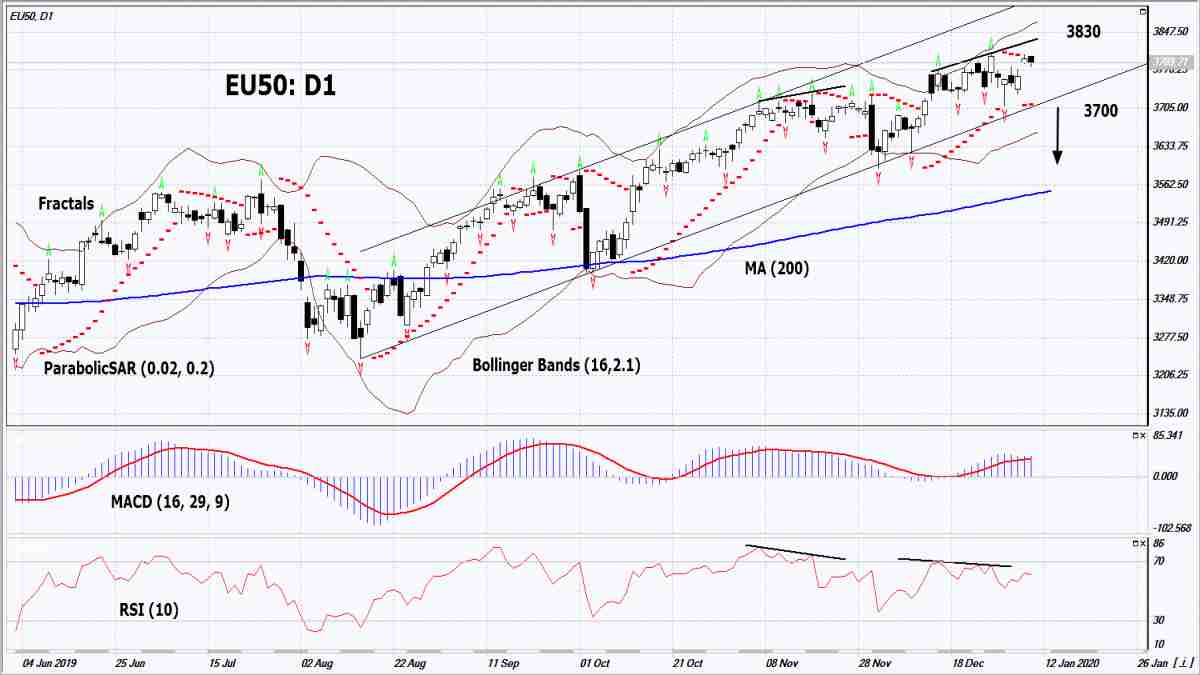
On the daily timeframe, the EU50: D1 is in a rising channel. Before opening a position, its lower boundary should be breached down. In general, the increase slowed down and a number of technical analysis indicators formed sell signals. The correction is possible in case of the publication of negative earnings reports of European companies.
- The Parabolic indicator gives a bullish signal. It can be used as an additional support level, which should be breached down before opening a position.
- The Bollinger bands have narrowed, which indicates low volatilit.
- The RSI indicator is above 50. It has formed a negative divergence.
- The MACD indicator gives a bearish signal.
The bearish momentum may develop in case EU50 falls below the last fractal low, the Parabolic signal and the lower boundary of the falling channel at 3700. This level may serve as an entry point. The initial stop loss may be placed above the last fractal high and the maximum since April 2015 at 3830. After opening the pending order, we shall move the stop to the next fractal high following the Bollinger and Parabolic signals. Thus, we are changing the potential profit/loss to the breakeven point. More risk-averse traders may switch to the 4-hour chart after the trade and place there a stop loss moving it in the direction of the trade. If the price meets the stop level (3830) without reaching the order (3700), we recommend cancelling the position: the market sustains internal changes that were not taken into account.
Summary of technical analysis
| Position | Sell |
| Sell stop | Below 3700 |
| Stop loss | Above 3830 |
Explore our
Trading Conditions
- Spreads from 0.0 pip
- 30,000+ Trading Instruments
- Stop Out Level - Only 10%
Ready to Trade?
Open Account Note:
This overview has an informative and tutorial character and is published for free. All the data, included in the overview, are received from public sources, recognized as more or less reliable. Moreover, there is no guarantee that the indicated information is full and precise. Overviews are not updated. The whole information in each overview, including opinion, indicators, charts and anything else, is provided only for familiarization purposes and is not financial advice or а recommendation. The whole text and its any part, as well as the charts cannot be considered as an offer to make a deal with any asset. IFC Markets and its employees under any circumstances are not liable for any action taken by someone else during or after reading the overview.
