- Analytics
- Technical Analysis
EUR/SEK Technical Analysis - EUR/SEK Trading: 2021-03-02
EUR/SEK Technical Analysis Summary
Above 10.24
Buy Stop
Below 9.96
Stop Loss
| Indicator | Signal |
| RSI | Neutral |
| MACD | Buy |
| MA(200) | Neutral |
| Fractals | Buy |
| Parabolic SAR | Buy |
| Bollinger Bands | Neutral |
EUR/SEK Chart Analysis
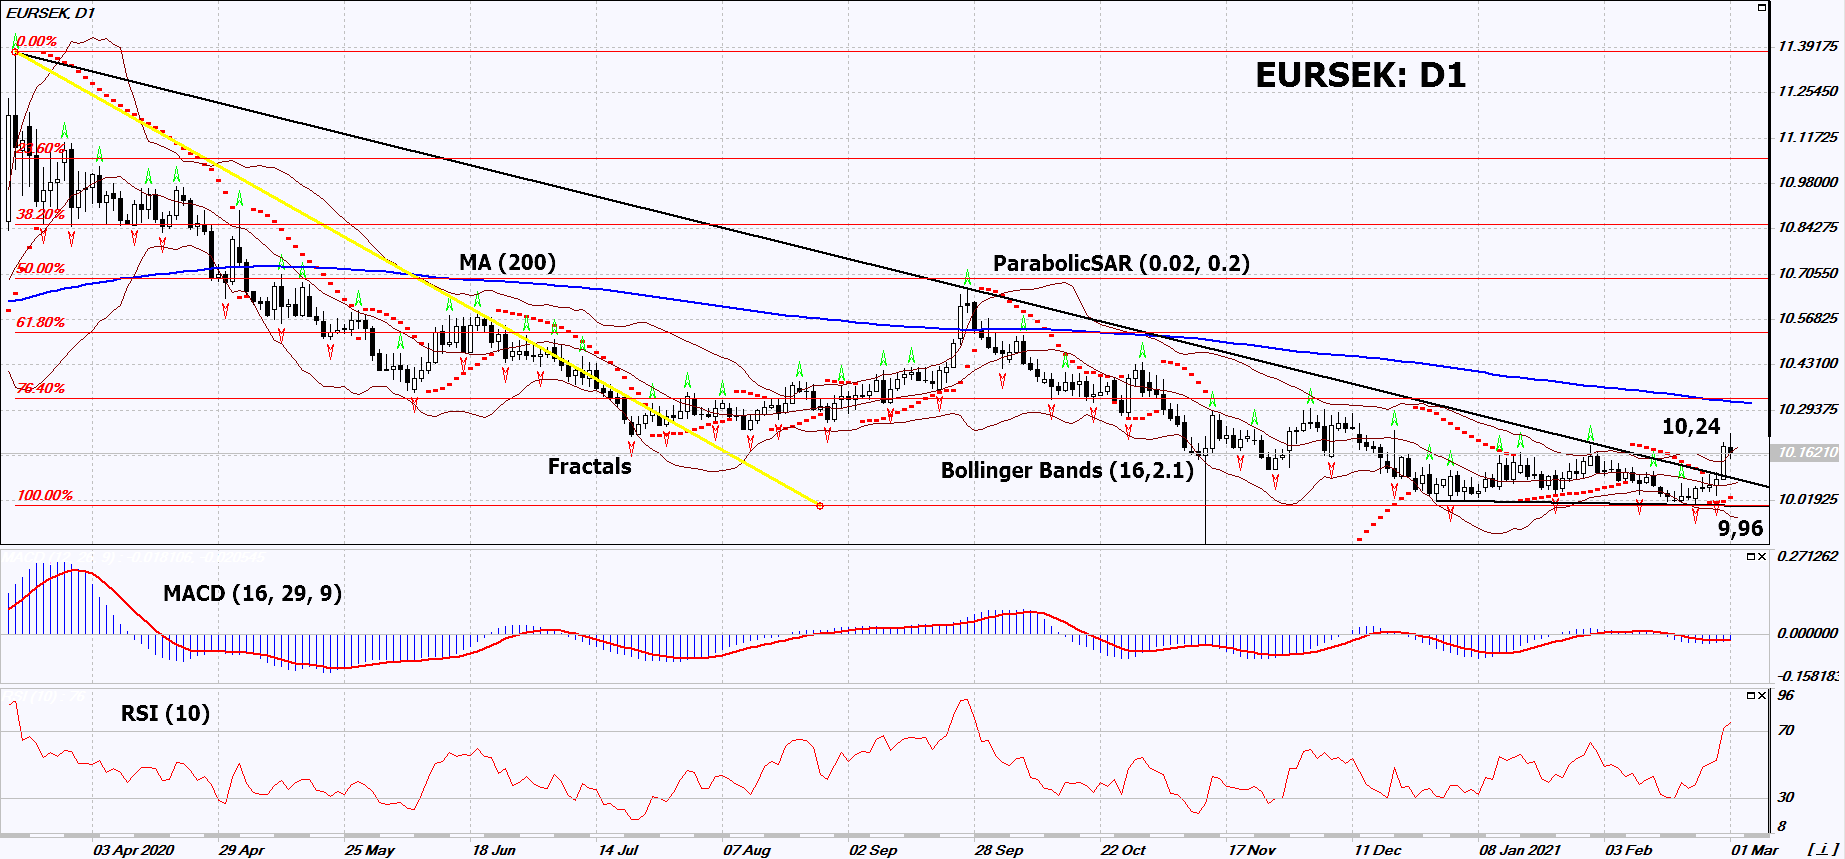
EUR/SEK Technical Analysis
On the daily timeframe, EURSEK: D1 broke upward the resistance line of the long-term downtrend and, at the same time, exited the short-term triangle. A number of technical analysis indicators formed signals for further growth. We do not rule out a bullish movement if EURSEK: D1 rises above its latest high: 10.24. This level can be used as an entry point. The initial risk limitation is possible below the Parabolic signal, the lower Bollinger band, the last lower fractal and the 3-year low: 9.96. After opening a pending order, we move the stop loss following the Bollinger and Parabolic signals to the next fractal low. Thus, we change the potential profit/loss ratio in our favor. After the transaction, the most risk-averse traders can switch to the four-hour chart and set a stop loss, moving it in the direction of the bias. If the price meets the stop loss (9.96) without activating the order (10.24), it is recommended to delete the order: the market sustains internal changes that have not been taken into account.
Fundamental Analysis of Forex - EUR/SEK
Weak macroeconomic data came out in Sweden. Will the EURSEK quotes rise?
The upward movement means the strengthening of the euro against the Swedish krona. Unemployment in Sweden in January this year rose to 9.3% from 8.2% in December last year. This is the maximum since June 2020. The decline in GDP in Q4 of last year was -0.2% (in quarterly terms), while an increase of +0.5% was expected. Swedbank Manufacturing PMI fell to 61.6 in February from 62.5 in January. It was expected to advance to 68.8. Similarly, the Eurozone’s Markit Manufacturing PMI rose to 57.9 in February from 54.8 in January, overperforming forecasts. The Swedish krona may be negatively impacted by the tightening of quarantine measures since March 1st in Sweden due to the increase in the number of coronavirus cases.
Explore our
Trading Conditions
- Spreads from 0.0 pip
- 30,000+ Trading Instruments
- Stop Out Level - Only 10%
Ready to Trade?
Open Account Note:
This overview has an informative and tutorial character and is published for free. All the data, included in the overview, are received from public sources, recognized as more or less reliable. Moreover, there is no guarantee that the indicated information is full and precise. Overviews are not updated. The whole information in each overview, including opinion, indicators, charts and anything else, is provided only for familiarization purposes and is not financial advice or а recommendation. The whole text and its any part, as well as the charts cannot be considered as an offer to make a deal with any asset. IFC Markets and its employees under any circumstances are not liable for any action taken by someone else during or after reading the overview.

