- Analytics
- Technical Analysis
EUR/USD Technical Analysis - EUR/USD Trading: 2015-01-26
Eurogroup meeting
We continue to keep an eye on the euro as the ECB launched quantitative easing program. Recall that the regulator will start money printing this March. This is a bond-buying program in the amount of 60 billion euro paid monthly. The program will last until September of the next year, and the total amount will exceed 1 trillion euro. The event is a milestone for long-term investors: the cash filling would bolster exporters, but it currently leads to the euro depreciation and inflation in the eurozone. The euro opened with a bearish gap on Monday (D1 chart). Positive data on business climate in Germany softened the market reaction: there is a possibility of a weak retracement which can be used to search for a suitable entry point. Eurogroup will hold another emergency meeting due to growing conflict in Eastern Ukraine. The meeting results are not really promising for strengthening trade relations of the EU. The issue on the next round of sanctions will be raised; therefore, we expect a new impetus of euro weakening.
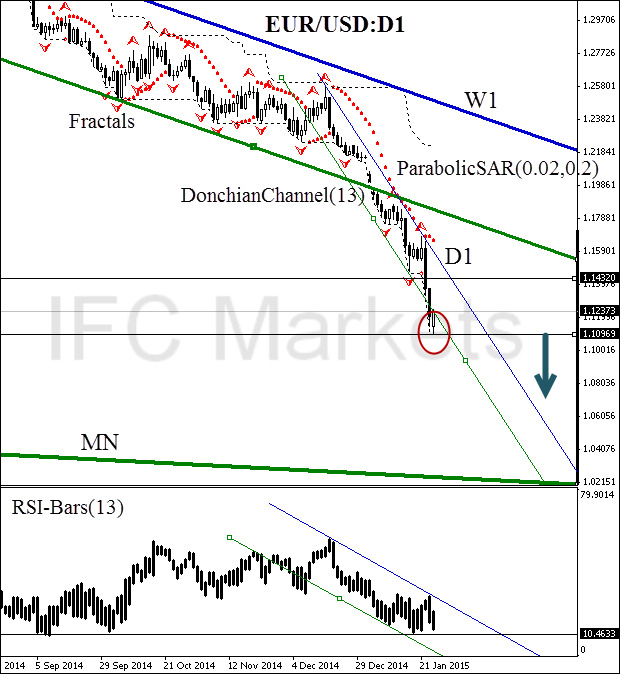
We can see that EUR/USD has accelerated in falling, breaking the weekly and daily support lines. The current daily price channel is confirmed by the lower Donchian Channel and Parabolic historical values. We expect the confirmation of the last breakout on the RSI-Bars oscillator chart. After the bar breaks the level at 10.4633%, we will get the signal for going short. It will probably coincide with the local support price breakout at 1.10969. This mark can be used for opening a pending sell order. Stop Loss is to be placed at the resistance line, for example, below the last fractal support at 1.14320. After order opening, Stop Loss is to be moved after Parabolic values near the next fractal high. Thus, we are changing the probable profit/loss ratio to the breakeven point. Partially, 50% of the position can be closed near the monthly support line.
| Position | Sell |
| Sell stop | below 1.10969 |
| Stop loss | above 1.14320 |
Explore our
Trading Conditions
- Spreads from 0.0 pip
- 30,000+ Trading Instruments
- Stop Out Level - Only 10%
Ready to Trade?
Open Account Note:
This overview has an informative and tutorial character and is published for free. All the data, included in the overview, are received from public sources, recognized as more or less reliable. Moreover, there is no guarantee that the indicated information is full and precise. Overviews are not updated. The whole information in each overview, including opinion, indicators, charts and anything else, is provided only for familiarization purposes and is not financial advice or а recommendation. The whole text and its any part, as well as the charts cannot be considered as an offer to make a deal with any asset. IFC Markets and its employees under any circumstances are not liable for any action taken by someone else during or after reading the overview.
