- Analytics
- Technical Analysis
EUR/USD Technical Analysis - EUR/USD Trading: 2016-02-09
Important data in EU on Friday
Euro on the chart has left the triangle to move upwards, mainly due to the weaker US dollar. Now investors strongly doubt the Fed will raise interest rates this year amid world economic slowdown. This week the important economic data will come out in Eurozone while in the USA the Fed Chair will speak in Senate. Will this news provoke trend movement in euro?
The Fed Chair Janet Yellen will speak in front of the US Senate Committee on Banking on Wednesday and Thursday. She is likely to give some hints on the Fed plans on further interest rate changes. On Friday the significant economic statistics will come out in EU: January inflation and Q4 GDP in Germany, December industrial production and Q4 GDP in Eurozone. We believe the tentative outlook is moderate. The active euro strengthening is possible if the data are better than expected.
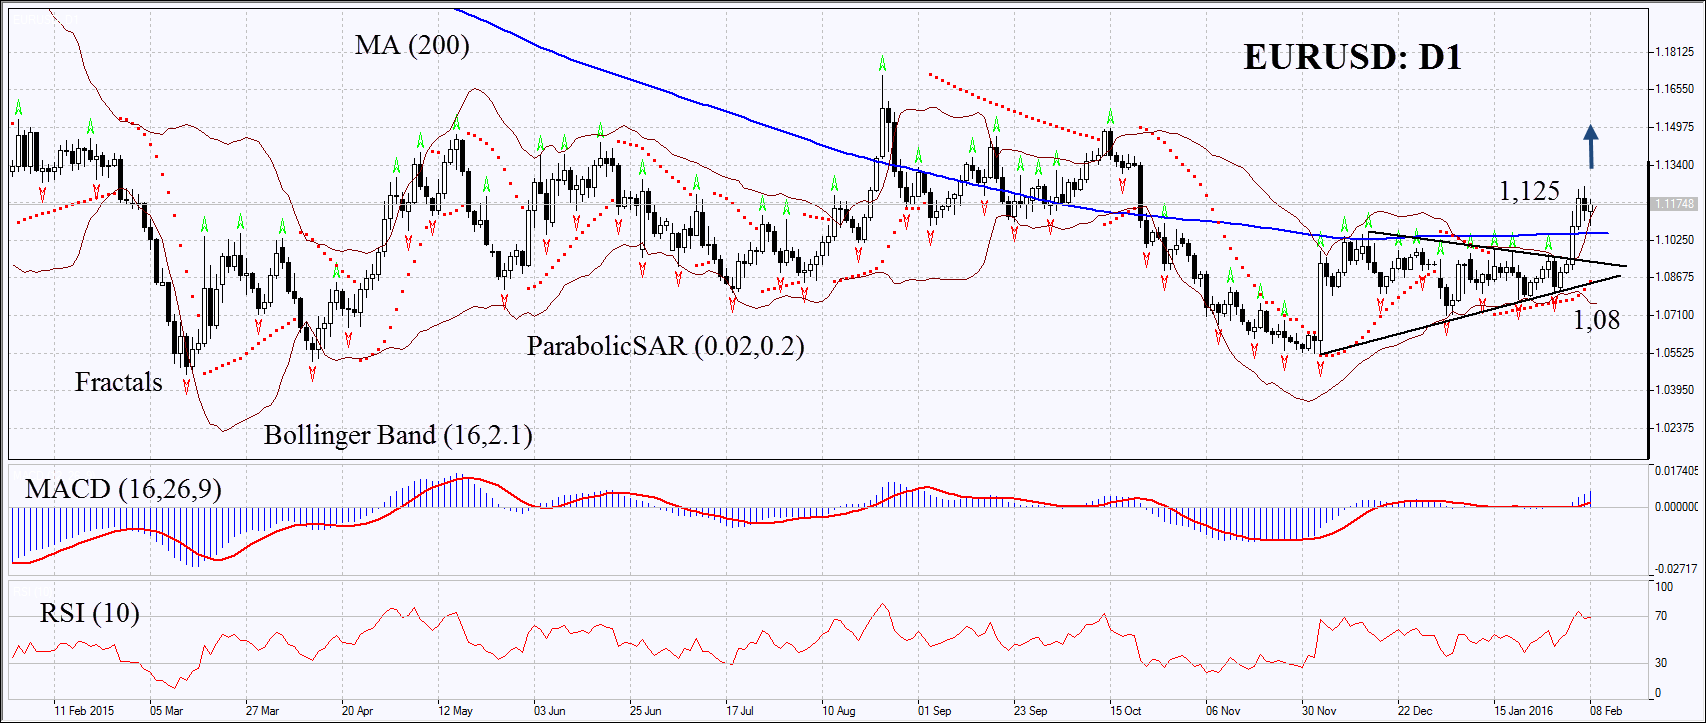
On the daily chart EURUSD: D1 has left the flat trend the triangle to the upwards having surpassed the 200-day moving average. The MACD and Parabolic indicators give buy signals. RSI has reached the overbought zone, no divergence. The Bollinger bands have widened a lot which may mean higher volatility. The bullish momentum may develop in case the euro surpasses the last high at 1.125. This level may serve the point of entry. The initial risk-limit may be placed below the Parabolic signal and the last fractal low at 1.08. Having opened the pending order we shall move the stop to the next fractal low following the Parabolic and Bollinger signals. Thus, we are changing the probable profit/loss ratio to the breakeven point. The most risk-averse traders may switch to the 4-hour chart after the trade and place there a stop-loss moving it in the direction of the trade. If the price meets the stop-loss level at 1.08 without reaching the order at 1.125, we recommend cancelling the position: the market sustains internal changes which were not taken into account.
| Position | Buy |
| Buy stop | above 1,125 |
| Stop loss | below 1,08 |
- Get Certificate

Note:
This overview has an informative and tutorial character and is published for free. All the data, included in the overview, are received from public sources, recognized as more or less reliable. Moreover, there is no guarantee that the indicated information is full and precise. Overviews are not updated. The whole information in each overview, including opinion, indicators, charts and anything else, is provided only for familiarization purposes and is not financial advice or а recommendation. The whole text and its any part, as well as the charts cannot be considered as an offer to make a deal with any asset. IFC Markets and its employees under any circumstances are not liable for any action taken by someone else during or after reading the overview.
