- Analytics
- Technical Analysis
UK 100 Technical Analysis - UK 100 Trading: 2016-11-28
Higher metal prices and positive economic data lifted up FTSE 100
British FTSE 100 index climbed for 3rd straight time last week as non-ferrous metal prices advanced and positive economic data came out. Will the trend persist?
Mining sector accounts for 11.09% of British stock market index while manufacturing accounts for another 6.13% and energy sector accounts for 19.52%. Zinc hit a fresh 8-1/2-year high on Friday while lead hit a 3-1/2 year high. Other non-ferrous metals including copper also ended the week higher. British Office for National Statistics reported on Friday that capital spending rose 0.9% in Q3 2016 which is above the anticipated 0.6%. Private consumption slightly slowed down in Q3 to 0.7% from 0.9% in Q2 but the GDP was not revised down in 2nd reading. The GDP rose 2.3% YoY. Retail sales showed record increase in November in recent 12 months. Last week British pound showed record increase against the euro since the start of last year. Meanwhile, compared to the Brexit level, now the British pound 10% lower against the euro remains and 16% lower against the US dollar. This may be caused by significant economic expansion in UK in Q3 (+2.3% YoY) compared to 1.6%-growth in Eurozone. Such a trend may continue having a positive effect on FTSE 100. It soared 9.5% since the start of 2016 while pan-European EURO STOXX 50 slumped 6.7%.
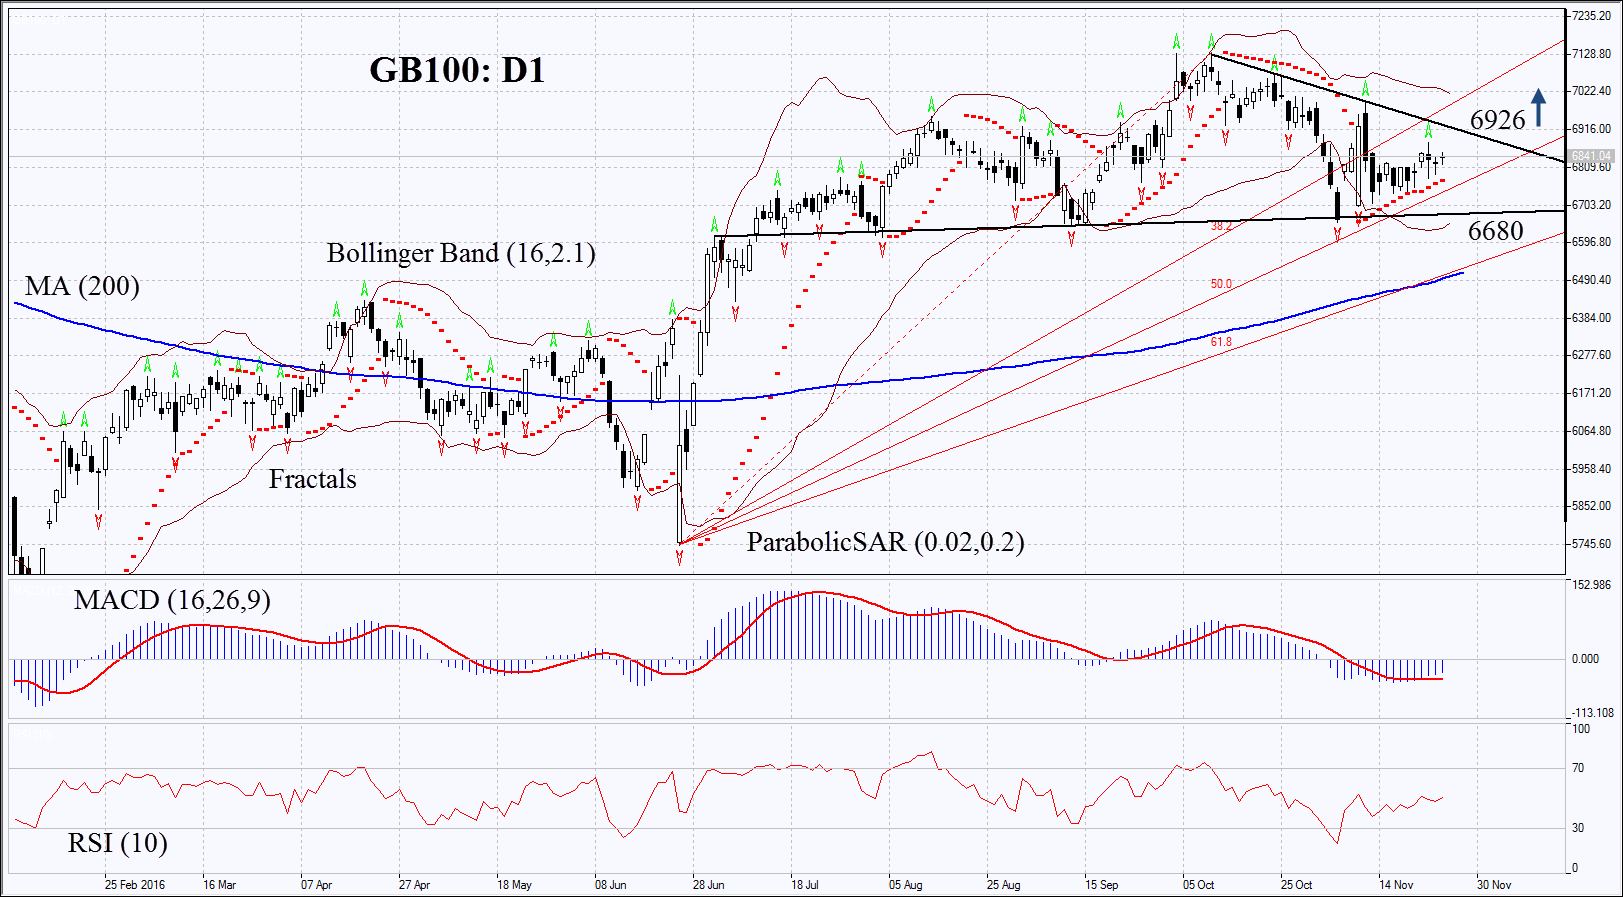
On the daily chart GB100: D1 is within the triangle moving towards its resistance line. Further price increase is possible in case strong economic data come out.
- Parabolic gives bullish signal.
- Bollinger bands have widened slightly which means normal volatility.
- RSI is close to 50 but is far from the overbought zone, no divergence.
- MACD gives bullish signal.
The bullish momentum may develop in case GB100 leaves the triangle to move upwards thus surpassing the upper resistance and fractal high at 6926. This level may serve the point of entry. The initial stop-loss may be placed below the triangle support at 6680. Having opened the pending order we shall move the stop to the next fractal low following the Parabolic and Bollinger signals. Thus, we are changing the probable profit/loss ratio to the breakeven point. The most risk-averse traders may switch to the 4-hour chart after the trade and place there a stop-loss moving it in the direction of the trade. If the price meets the stop-loss level at 6680 without reaching the order at 6926, we recommend cancelling the position: the market sustains internal changes which were not taken into account.
Summary of technical analysis
| Position | Buy |
| Buy stop | above 6926 |
| Stop loss | below 6680 |
Explore our
Trading Conditions
- Spreads from 0.0 pip
- 30,000+ Trading Instruments
- Stop Out Level - Only 10%
Ready to Trade?
Open Account Note:
This overview has an informative and tutorial character and is published for free. All the data, included in the overview, are received from public sources, recognized as more or less reliable. Moreover, there is no guarantee that the indicated information is full and precise. Overviews are not updated. The whole information in each overview, including opinion, indicators, charts and anything else, is provided only for familiarization purposes and is not financial advice or а recommendation. The whole text and its any part, as well as the charts cannot be considered as an offer to make a deal with any asset. IFC Markets and its employees under any circumstances are not liable for any action taken by someone else during or after reading the overview.
