- Analytics
- Technical Analysis
GBP/USD Technical Analysis - GBP/USD Trading: 2015-12-10
Anticipating Bank of England meeting
On Thursday, December 10, the next Bank of England meeting will take place and the October trade balance will be released. The external trade data is expected to be quite weak but the pound has strengthened significantly. Investors hope the Old Lady will comment on possible monetary tightening. Markets assume the next interest rates hike – after the Fed – will take place in UK. With the pound continue its way up?
Major banks are of mixed opinion. ING anticipates the Bank of England will start raising rates since May 2016 and admits the stronger pound ahead of the inflation data in UK next week. On December 15 the November inflation will be released. Unfortunately, there are no objective predictions yet but September and October year-over-year readings showed deflation. The Societe Generale and RBC Royal Bank believe the pound may continue weakening amid the matter of UK leaving EU. The referendum on this subject may be held in June 2016 already although it was previously scheduled for 2017.
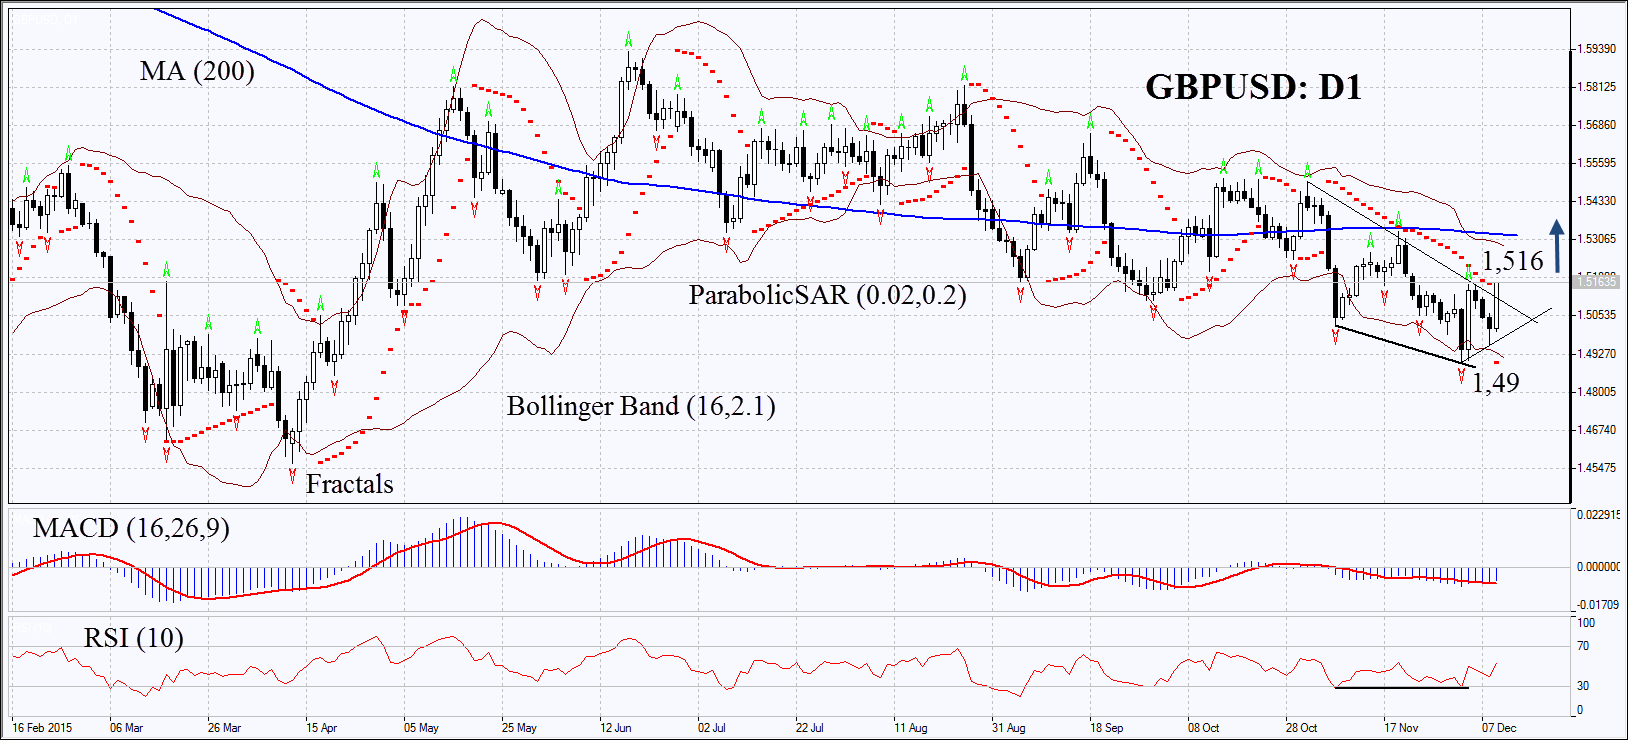
On the daily chart GBPUSD: D1 has surpassed the resistance of the downtrend. The Parabolic and MACD indicators have formed the buy signals. The Bollinger bands have contracted which may mean lower volatility. RSI has formed the positive divergence and have not yet reached the overbought zone. The bullish momentum may develop in case the pound surpasses the last fractal high and the Parabolic signal at 1.516. This level may serve the point of entry given the latest meeting of the Bank of England. The initial risk-limit may be placed below the Parabolic signal, the last fractal low and the Bollinger band at 1.49. Having opened the pending order we shall move the stop to the next fractal low following the Parabolic and Bollinger signals. Thus, we are changing the probable profit/loss ratio to the breakeven point. The most risk-averse traders may switch to the 4-hour chart after the trade and place there a stop-loss moving it in the direction of the trade. If the price meets the stop-loss level at 1.49 without reaching the order at 1.516, we recommend cancelling the position: the market sustains internal changes which were not taken into account.
| Position | Buy |
| Buy stop | above 1,516 |
| Stop loss | below 1,49 |
Explore our
Trading Conditions
- Spreads from 0.0 pip
- 30,000+ Trading Instruments
- Stop Out Level - Only 10%
Ready to Trade?
Open Account Note:
This overview has an informative and tutorial character and is published for free. All the data, included in the overview, are received from public sources, recognized as more or less reliable. Moreover, there is no guarantee that the indicated information is full and precise. Overviews are not updated. The whole information in each overview, including opinion, indicators, charts and anything else, is provided only for familiarization purposes and is not financial advice or а recommendation. The whole text and its any part, as well as the charts cannot be considered as an offer to make a deal with any asset. IFC Markets and its employees under any circumstances are not liable for any action taken by someone else during or after reading the overview.
