- Analytics
- Technical Analysis
GBP/USD Technical Analysis - GBP/USD Trading: 2016-03-09
The British pound is awaiting economic data
On Tuesday the head of the Bank of England Governor Mark Carney spoke in the British Parliament against the UK exit from the EU (Brexit). The national referendum on the matter will take place on 23rd of June. The UK exit from the EU risk is weakening the British pound. It has fallen to a 7-year low at the end of February but then increased in rate. Head of Bank of England speech was not able to support the pound. Its rate has decreased on Tuesday amid weak external trade statistics from China and the subsequent fall in prices for raw materials, especially for nonferrous metals. A significant macroeconomic statistics will be released in the UK this week. Shall the increase of the pound continue?
Prior to that, it was increasing during 6 days in a row. On Tuesday, the pound began to decrease in rates. We do not exclude that the participants of the market are already ‘mature’ for taking profits. Industrial production data for January will be released in the UK on Wednesday; and construction and foreign trade data is to be announced on Friday. It will be published at 10:30 CET. In our view the forecasts of macroeconomic indicators are positive and may contribute to the resumption of the pound sterling hike. However, investors may not to take any action until next week. In this case, the pound is likely to be in a neutral trend. Next Wednesday, 16th of March, the inflation data will be released, and on Thursday, 17th of March, a regular meeting of the Bank of England will be held. The change of interest rate is not expected, but the final report will comment on the current state of the economy.
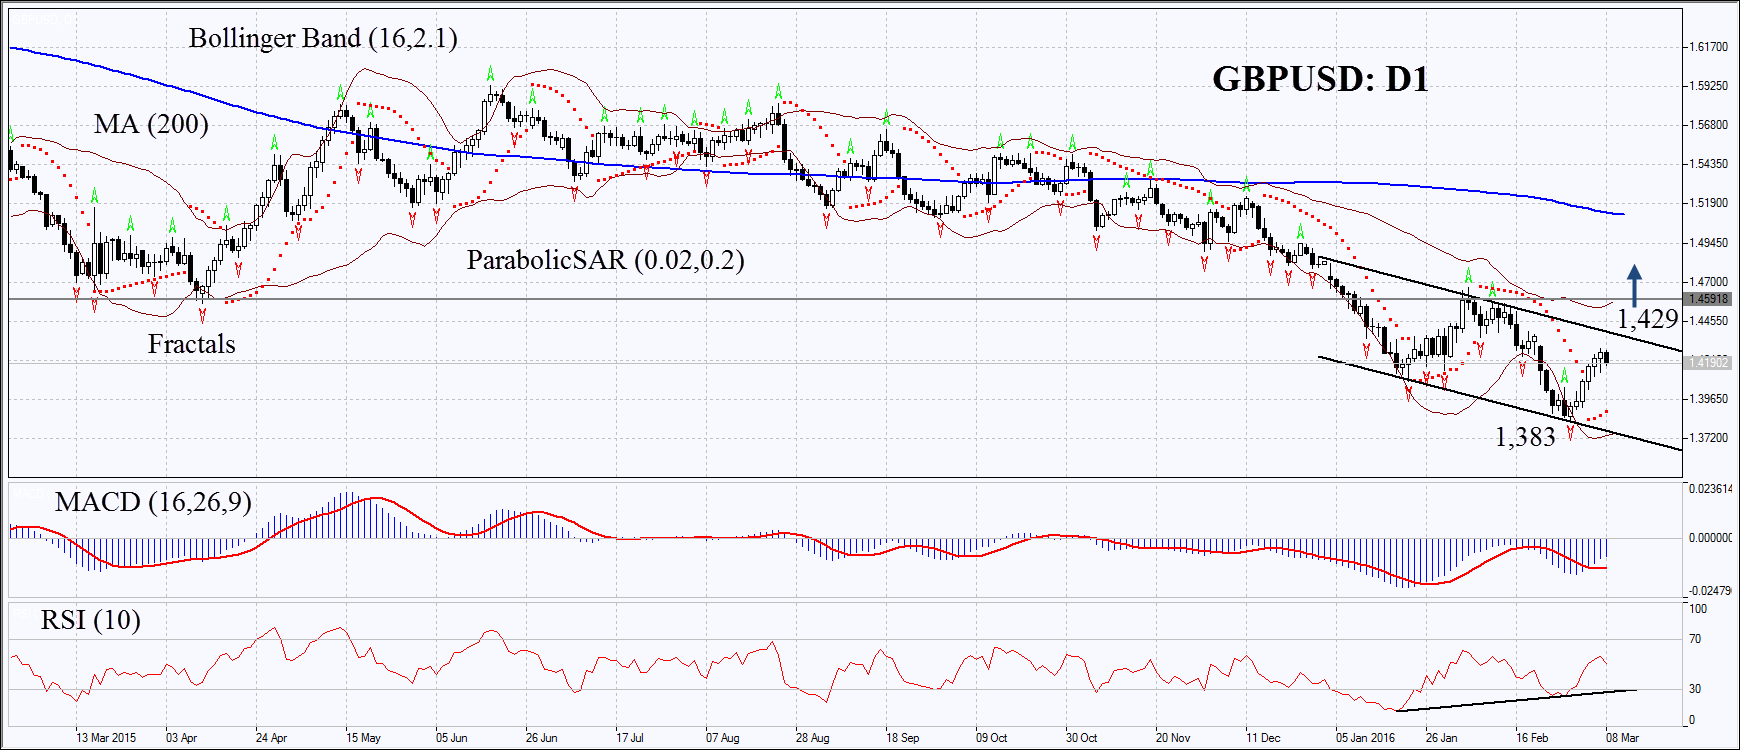
On the daily timeframe, GBPUSD: D1 is correcting upward from the bottom of the falling trend. Parabolic indicator and MACD formed a signal to buy. The RSI indicator is increasing and has exceeded 50. It formed the divergence to buy. Bollinger bands widened, which means high volatility. It is tilted upward. We do not exclude bullish movement if the pound exceeds the last local maximum: 1,429. This level can be used as an entry point. The initial restriction of possible risk could be set below the last lower fractal and 7-year low: 1,383. After opening of a pending order we should move the stop loss after Bollinger and Parabolic to the next fractal low. Thus, we are changing the potential ratio of profit/loss in our favor. Most cautious traders can change to a four-hour time frame and set the stop-loss following the direction of a price after making the deal. If the price overcomes the stop level (1,383) without activating the order (1,429) the position is recommended to be removed: the market internal changes occur that were taken into account.
| Position | Buy |
| Buy stop | above 1,429 |
| Stop loss | below 1,383 |
- Get Certificate

Note:
This overview has an informative and tutorial character and is published for free. All the data, included in the overview, are received from public sources, recognized as more or less reliable. Moreover, there is no guarantee that the indicated information is full and precise. Overviews are not updated. The whole information in each overview, including opinion, indicators, charts and anything else, is provided only for familiarization purposes and is not financial advice or а recommendation. The whole text and its any part, as well as the charts cannot be considered as an offer to make a deal with any asset. IFC Markets and its employees under any circumstances are not liable for any action taken by someone else during or after reading the overview.
