- Analytics
- Technical Analysis
GBP/USD Technical Analysis - GBP/USD Trading: 2018-07-04
The UK is trying to improve Brexit terms for itself
British Prime Minister Theresa May can require more concessions from the European Union regarding the terms for her country's exit from the EU. Will GBPUSD prices rise?
It is assumed that the negotiations on Brexit will last until the end of autumn 2018. After this, the terms should be approved by the European Parliament and the British Parliament. The UK’s withdrawal from the EU is scheduled for 29 March, 2019 with a transition period that will last until 31 December, 2020. Currently, the British authorities are discussing and want to receive some preferences in the work with the European Customs Union, as well as ensure the free activity of British companies in the European market of business services, audit and consulting. On Friday, the UK government is going to publish its proposals on the new terms of Brexit. Good data on the growth of business activity in construction for June of the current year were additional positive factors for the pound. The UK Construction PMI rose for the third consecutive month. Data on business activity in the service sector, which may affect the rate of the British currency, will be published on Wednesday.
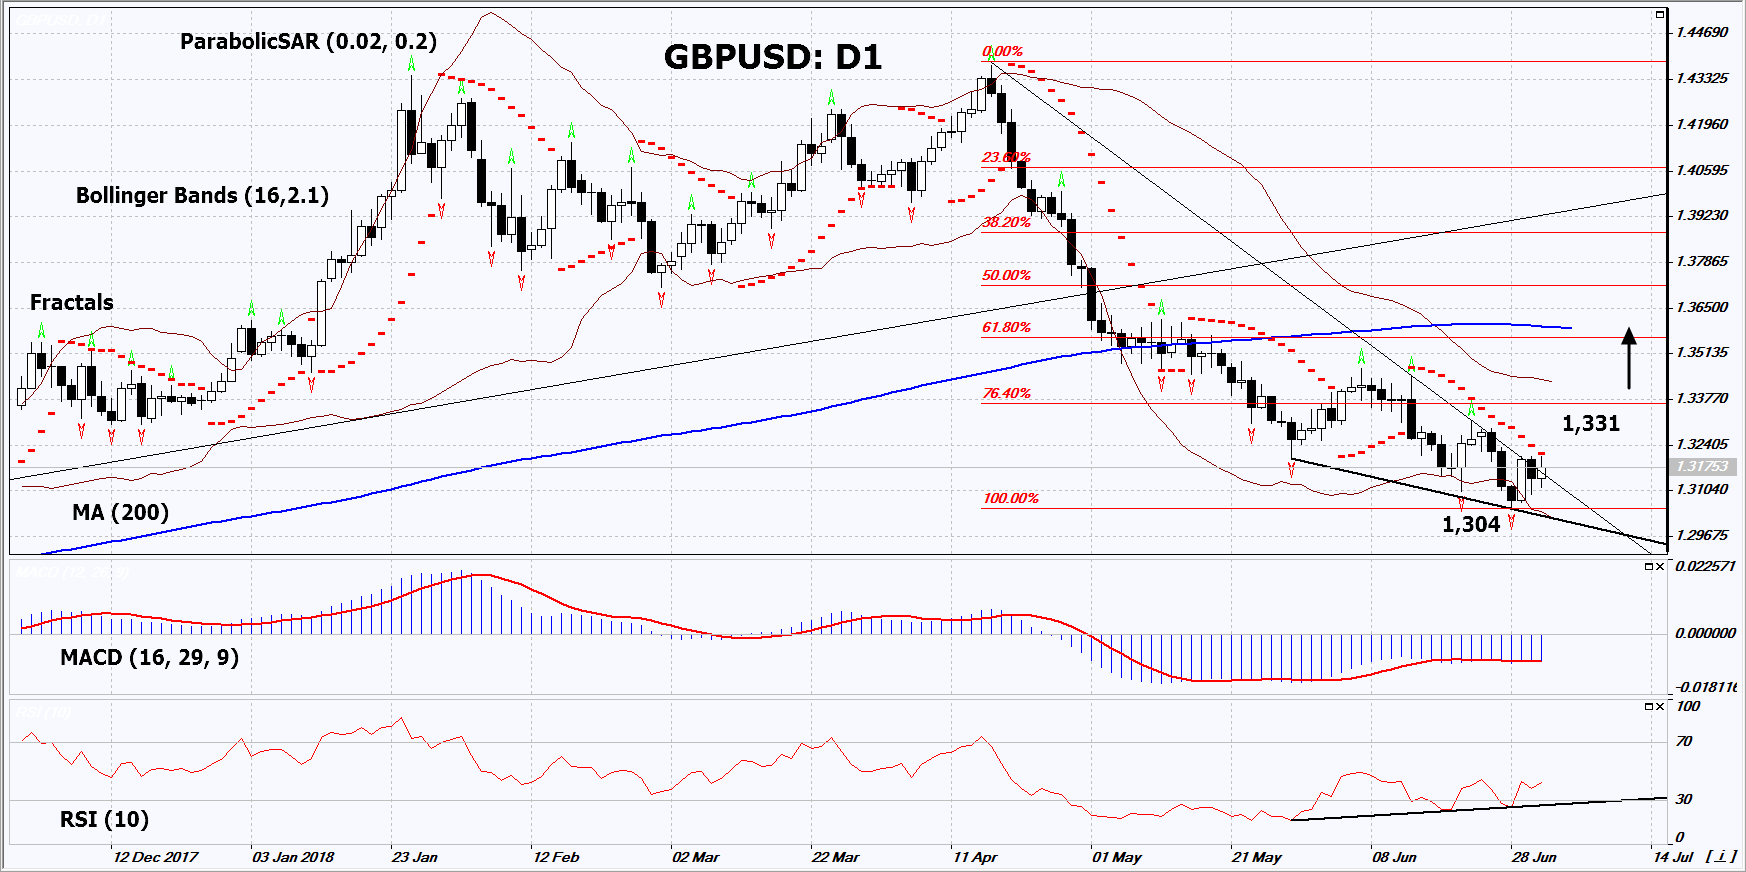
On the daily timeframe, GBPUSD: D1 approached the resistance line of the downtrend. Before opening a buy position, it should be breached up. The further price increase is possible in case of the publication of positive economic data in the UK and favorable terms of Brexit.
- The Parabolic indicator gives a bearish signal. It can be used as an additional resistance level, which should be overcome before opening a buy position.
- The Bollinger bands have widened, which indicates high volatility.
- The RSI indicator is below 50. It has formed a positive divergence.
- The MACD indicator gives a bullish signal.
The bullish momentum may develop in case GBPUSD exceeds the last fractal high at 1.331. This level may serve as an entry point. The initial stop loss may be placed below the last fractal low and the 9-month low at 1.304. After opening the pending order, we shall move the stop to the next fractal low following the Bollinger and Parabolic signals. Thus, we are changing the potential profit/loss to the breakeven point. More risk-averse traders may switch to the 4-hour chart after the trade and place there a stop loss moving it in the direction of the trade. If the price meets the stop level (1.304) without reaching the order (1.331), we recommend to close the position: the market sustains internal changes that were not taken into account.
Summary of technical analysis
| Position | Buy |
| Buy stop | Above 1.331 |
| Stop loss | Below 1.304 |
Explore our
Trading Conditions
- Spreads from 0.0 pip
- 30,000+ Trading Instruments
- Stop Out Level - Only 10%
Ready to Trade?
Open Account Note:
This overview has an informative and tutorial character and is published for free. All the data, included in the overview, are received from public sources, recognized as more or less reliable. Moreover, there is no guarantee that the indicated information is full and precise. Overviews are not updated. The whole information in each overview, including opinion, indicators, charts and anything else, is provided only for familiarization purposes and is not financial advice or а recommendation. The whole text and its any part, as well as the charts cannot be considered as an offer to make a deal with any asset. IFC Markets and its employees under any circumstances are not liable for any action taken by someone else during or after reading the overview.
