- Analytics
- Technical Analysis
GBP/USD Technical Analysis - GBP/USD Trading: 2019-01-14
UK may remain in the EU
The UK may refuse to exit from the EU if the parties fail to agree on Brexit. Will the British pound rise?
Foreign Secretary Jeremy Hunt said that the UK might remain in the European Union. Brexit was scheduled to take place on March 29, 2019. On January 15, a vote will be held in the British Parliament and during the vote, the plan of Prime Minister Theresa May on the terms of the country's withdrawal from the European Union is to be approved. Data on inflation for December, which may also affect the dynamics of the pound will be published on January 16 in the UK.
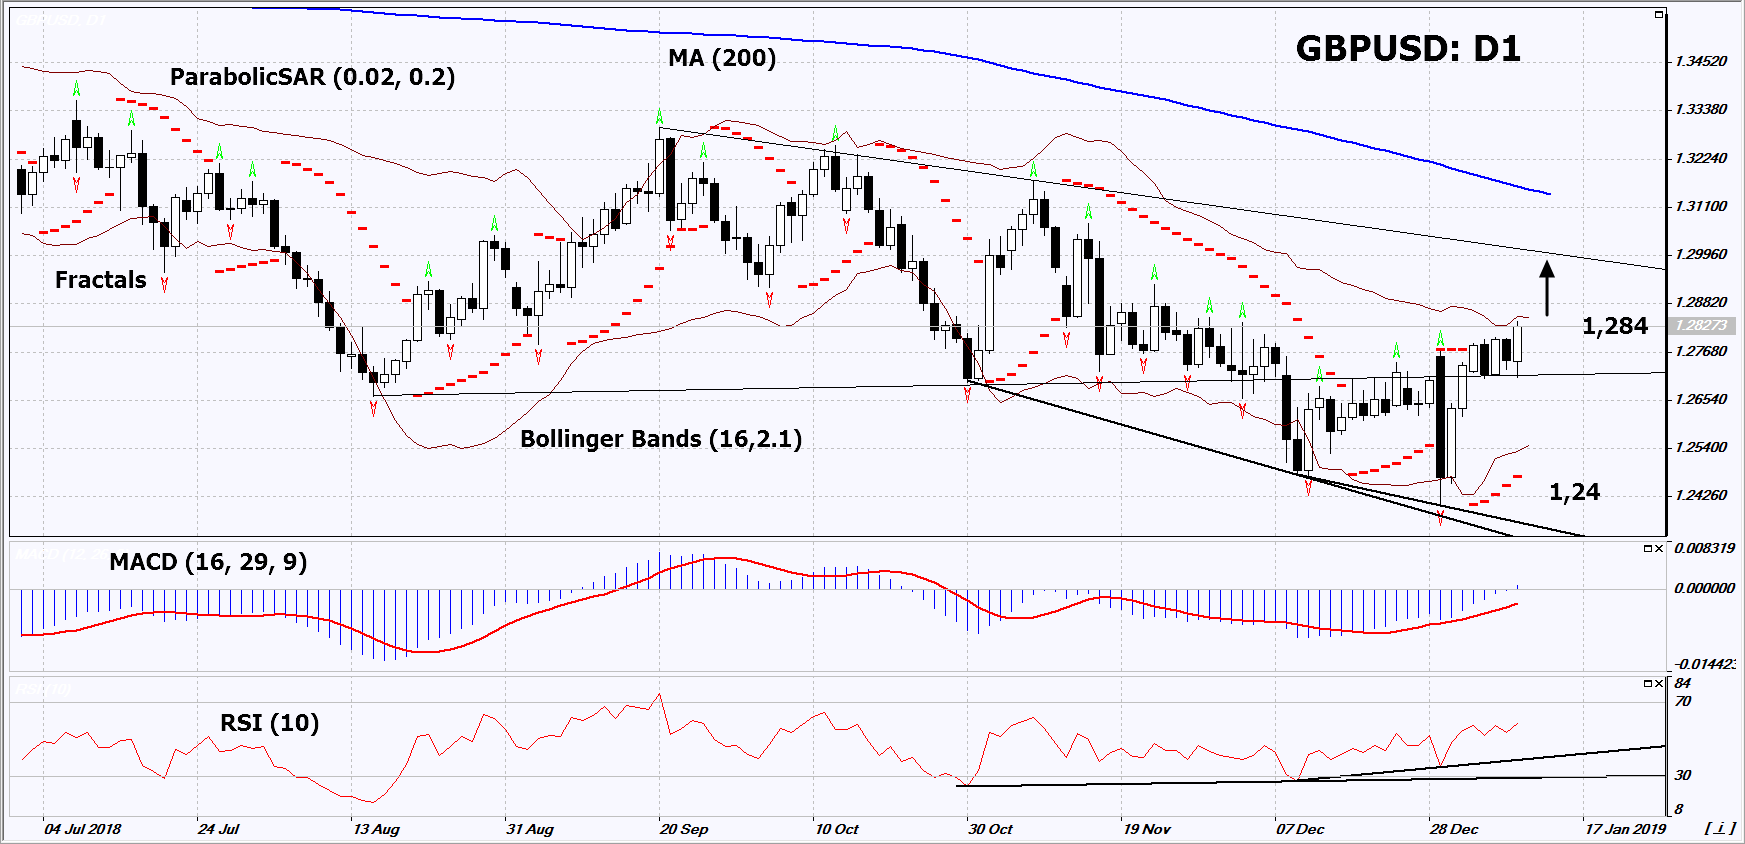
On the daily timeframe, GBPUSD: D1 is in a downtrend, but the decline has slowed down and a number of technical analysis indicators have formed buy signals. The further price increase is possible in case of the transfer of Brexit and publication of positive macroeconomic indicators in the UK.
- The Parabolic indicator gives a bullish signal.
- The Bollinger bands have narrowed, which indicates low volatility.
- The RSI indicator is above 50. It has formed a double positive divergence.
- The MACD indicator gives a bullish signal.
The bullish momentum may develop in case GBPUSD exceeds the upper Bollinger band at 1.284. This level may serve as an entry point. The initial stop loss may be placed below the last fractal low, the low since April 2017, the lower Bollinger band and the Parabolic signal at 1.24. After opening the pending order, we shall move the stop to the next fractal low following the Bollinger and Parabolic signals. Thus, we are changing the potential profit/loss to the breakeven point. More risk-averse traders may switch to the 4-hour chart after the trade and place there a stop loss moving it in the direction of the trade. If the price meets the stop level (1.24) without reaching the order (1.284), we recommend to close the position: the market sustains internal changes that were not taken into account.
Summary of technical analysis
| Position | Buy |
| Buy stop | Above 1.284 |
| Stop loss | Below 1.24 |
Explore our
Trading Conditions
- Spreads from 0.0 pip
- 30,000+ Trading Instruments
- Stop Out Level - Only 10%
Ready to Trade?
Open Account Note:
This overview has an informative and tutorial character and is published for free. All the data, included in the overview, are received from public sources, recognized as more or less reliable. Moreover, there is no guarantee that the indicated information is full and precise. Overviews are not updated. The whole information in each overview, including opinion, indicators, charts and anything else, is provided only for familiarization purposes and is not financial advice or а recommendation. The whole text and its any part, as well as the charts cannot be considered as an offer to make a deal with any asset. IFC Markets and its employees under any circumstances are not liable for any action taken by someone else during or after reading the overview.

