- Analytics
- Technical Analysis
Hog Futures Technical Analysis - Hog Futures Trading: 2019-03-06
African swine fever has spread from China to Vietnam
In the countries of Southeast Asia, an outbreak of African Swine Fever (ASF) is observed. Will LHOG prices rise?
Vietnamese authorities will take decisive measures to control ASF. From February 1 to March 3, the ASF was detected in 7 provinces of Northern Vietnam. Meanwhile, pork accounts for three-quarters of meat consumption in this country. Last year, Vietnam produced 3.82 million tons of pork. Now it is difficult to say how badly this outbreak of the disease will affect production in the current year. 4 thousand sick pigs have been destroyed in Vietnam so far. In China, ASF outbreaks have been observed since August 2018. The animal husbandry of 28 provinces has been affected, and direct and indirect losses may reach $1 trillion. Another positive factor for pork prices may be the abolition of duties on its imports from the US to China in case of positive results of the meeting of the heads of the United States and China on March 27. Let us note that according to the US Department of Agriculture, pork production in the last week of February decreased by 3% compared to the same period of 2018.
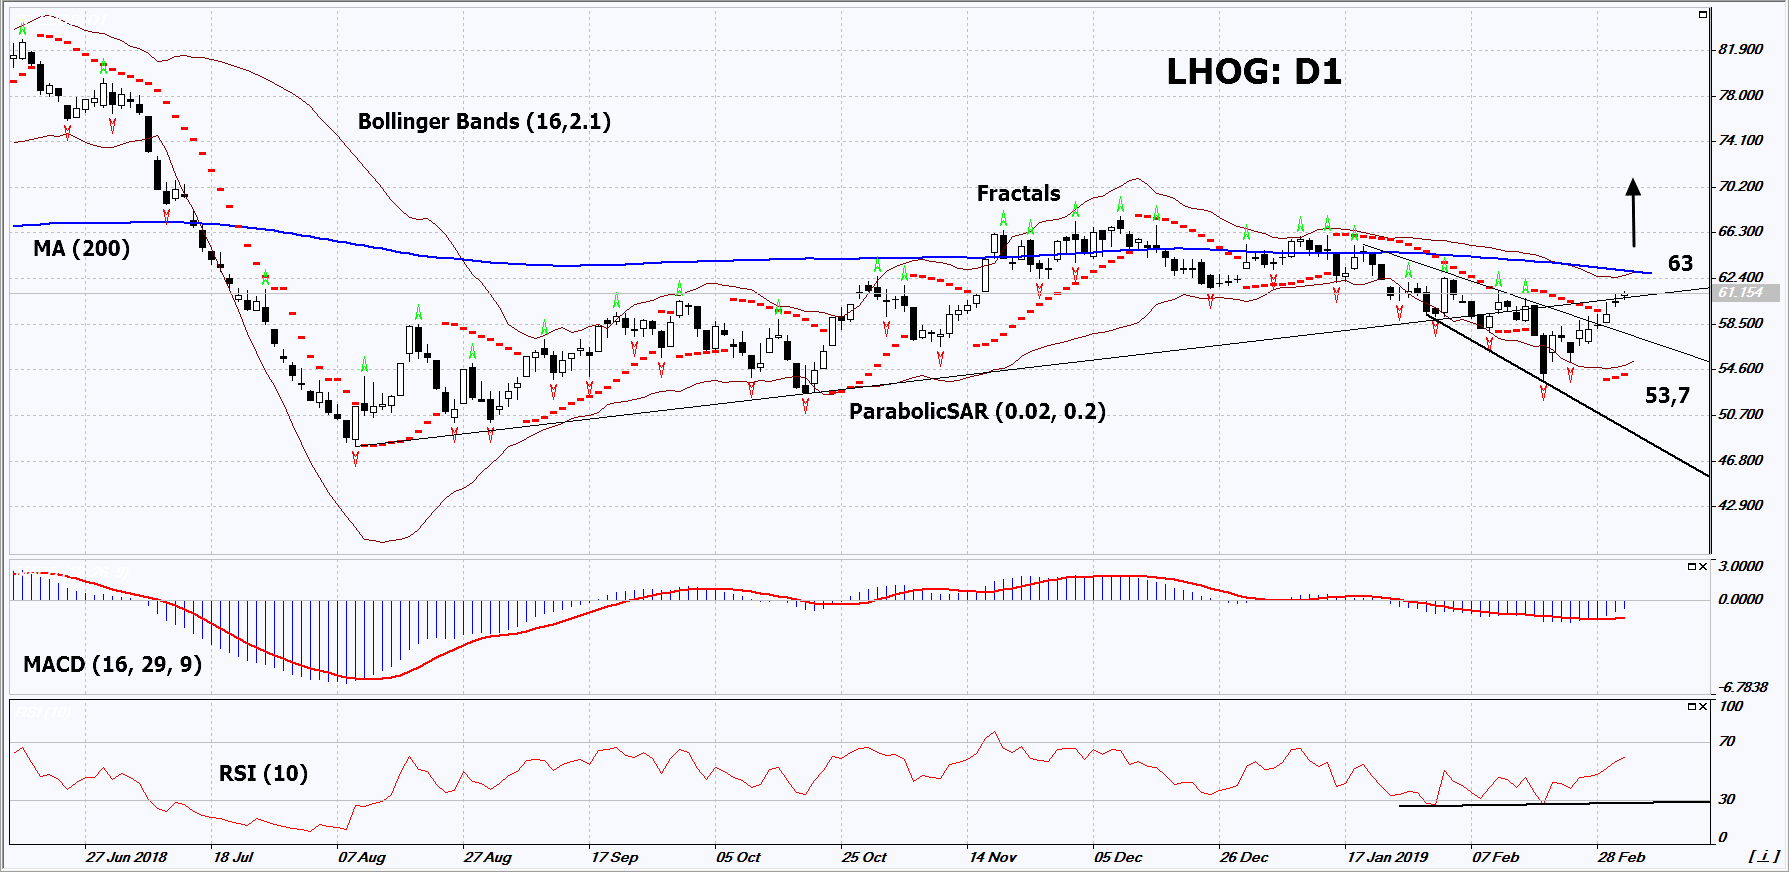
On the daily timeframe, LHOG: D1 overcome the resistance line of the downtrend. A number of technical analysis indicators formed buy signals. The further price growth is possible in case of the cancellation of duties on American pork in China and negative development of the situation with ASF.
- The Parabolic Indicator gives a bullish signal.
- The Bollinger bands have widened, which indicates high volatility. Both Bollinger bands are titled upward.
- The RSI indicator is above 50. It has formed a positive divergence.
- The MACD indicator gives a bullish signal.
The bullish momentum may develop in case LHOG exceeds the upper Bollinger band and the 200-day moving average line at 63. This level may serve as an entry point. The initial stop loss may be placed below the two last fractal lows, the lower Bollinger band and the Parabolic signal at 53.7. After opening the pending order, we shall move the stop to the next fractal low following the Bollinger and Parabolic signals. Thus, we are changing the potential profit/loss to the breakeven point. More risk-averse traders may switch to the 4-hour chart after the trade and place there a stop loss moving it in the direction of the trade. If the price meets the stop level (53.7) without reaching the order (63), we recommend to close the position: the market sustains internal changes that were not taken into account.
Summary of technical analysis
| Position | Buy |
| Buy stop | Above 63 |
| Stop loss | Below 53.7 |
- Get Certificate

Note:
This overview has an informative and tutorial character and is published for free. All the data, included in the overview, are received from public sources, recognized as more or less reliable. Moreover, there is no guarantee that the indicated information is full and precise. Overviews are not updated. The whole information in each overview, including opinion, indicators, charts and anything else, is provided only for familiarization purposes and is not financial advice or а recommendation. The whole text and its any part, as well as the charts cannot be considered as an offer to make a deal with any asset. IFC Markets and its employees under any circumstances are not liable for any action taken by someone else during or after reading the overview.
