- Analytics
- Technical Analysis
Gas Ruble Technical Analysis - Gas Ruble Trading: 2018-07-03
Cold snap in the US may reduce the demand for natural gas
In this review, we suggest considering the personal composite instrument (PCI) “Gas vs the Russian ruble”. It reflects the price dynamics of the US natural gas against the Russian ruble. Will GAS/RUB prices fall?
Such a movement means that the US natural gas prices fall, while the ruble strengthens. The meteorological forecast of a cold snap in the US in the next 2 weeks is an important prerequisite for the reduction of gas prices. Earlier, there was a strong heat, which increased the demand for electricity for air conditioning. Natural gas is widely used for electricity generation and its consumption has also increased. Its production in the US has now updated the historical high and reached 81.5 billion cubic feet per day on Friday. Over the past week, 73 billion cubic feet of gas has been pumped into US gas storage facilities. This is noticeably more than the same week last year - 60 billion cubic feet, and also more than the 5-year average level at the end of June - 70 billion. High world prices for hydrocarbon raw materials may contribute to the strengthening of the Russian ruble. The share of energy products in Russian exports is 65%.
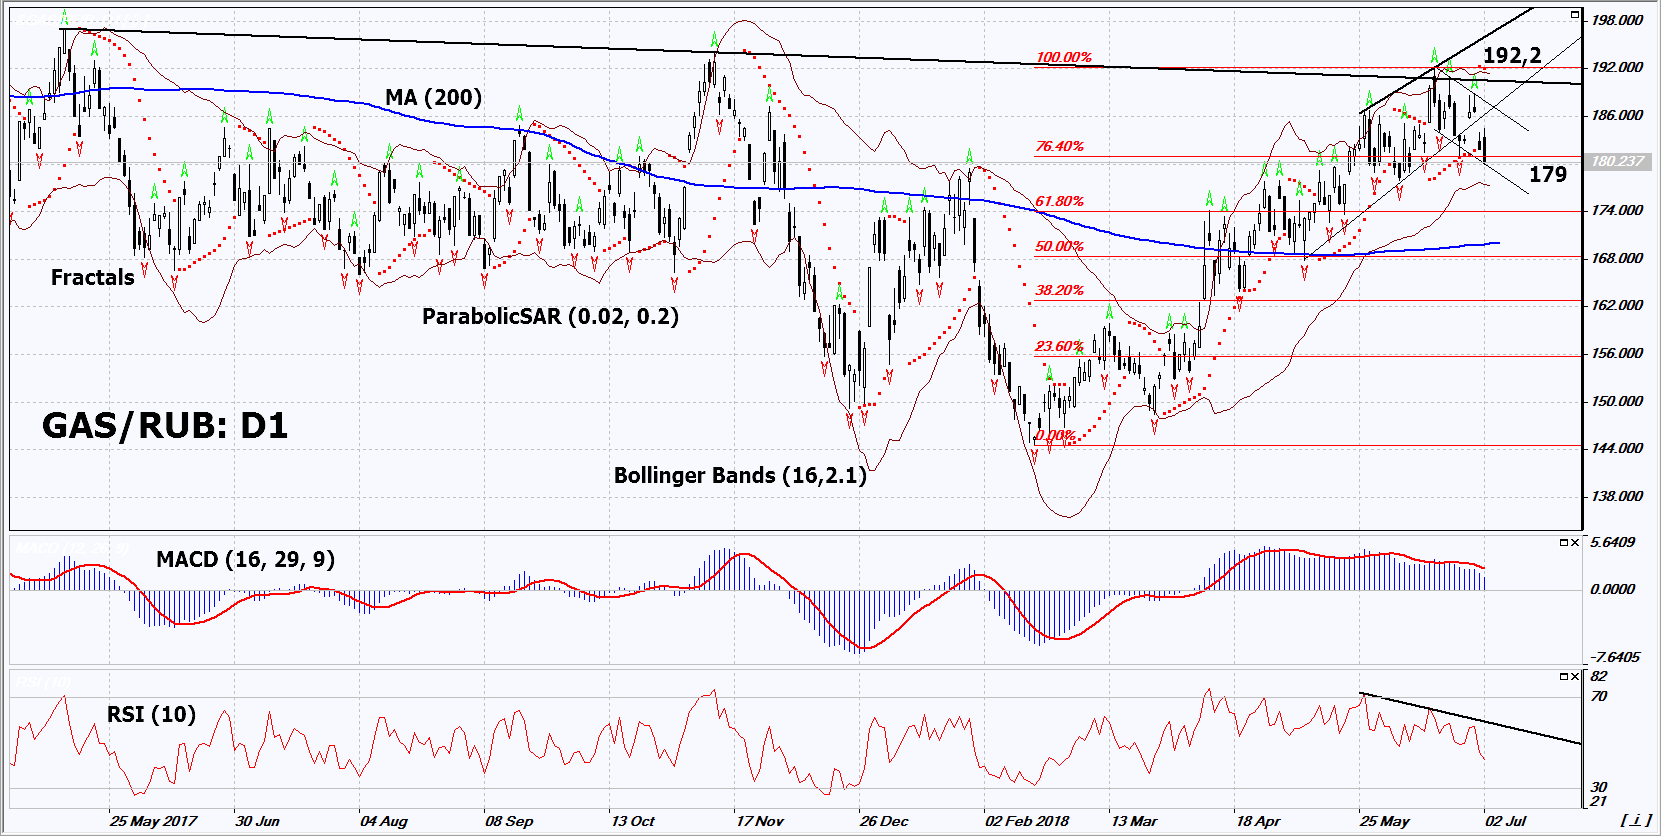
On the daily timeframe, GAS/RUB: D1 reached the upper resistance line of the wide neutral range and could not breached it up. The reduction in air temperature in the US and strengthening of the ruble amid stable high world oil prices may contribute to the further price decrease.
- The Parabolic indicator gives a sell signal.
- The Bollinger bands have narrowed, which indicates low volatility. They are titled downward.
- The RSI indicator is below 50. It has formed a negative divergence.
- The MACD indicator gives a sell signal.
The bearish momentum may develop in case GAS/RUB falls below its last low at 179. This level may serve as an entry point. The initial stop loss may be placed above the three last fractal highs, the 8-month high, the upper Bollinger band and the Parabolic signal at 192.2. After opening the pending order, we shall move the stop to the next fractal high following the Bollinger and Parabolic signals. Thus, we are changing the potential profit/loss to the breakeven point. More risk-averse traders may switch to the 4-hour chart after the trade and place there a stop loss moving it in the direction of the trade. If the price meets the stop level (192.2) without reaching the order (179), we recommend to close the position: the market sustains internal changes that were not taken into account.
Summary of technical analysis
| Position | Sell |
| Sell stop | Below 179 |
| Stop loss | Above 192.2 |
- Get Certificate

Note:
This overview has an informative and tutorial character and is published for free. All the data, included in the overview, are received from public sources, recognized as more or less reliable. Moreover, there is no guarantee that the indicated information is full and precise. Overviews are not updated. The whole information in each overview, including opinion, indicators, charts and anything else, is provided only for familiarization purposes and is not financial advice or а recommendation. The whole text and its any part, as well as the charts cannot be considered as an offer to make a deal with any asset. IFC Markets and its employees under any circumstances are not liable for any action taken by someone else during or after reading the overview.
