- Analytics
- Technical Analysis
Natural Gas Prices Technical Analysis - Natural Gas Prices Trading: 2021-11-10
Natural Gas Technical Analysis Summary
Below 5,05
Sell Stop
Above 6,3
Stop Loss
| Indicator | Signal |
| RSI | Sell |
| MACD | Buy |
| MA(200) | Neutral |
| Fractals | Sell |
| Parabolic SAR | Sell |
| Bollinger Bands | Neutral |
Natural Gas Chart Analysis
Natural Gas Technical Analysis
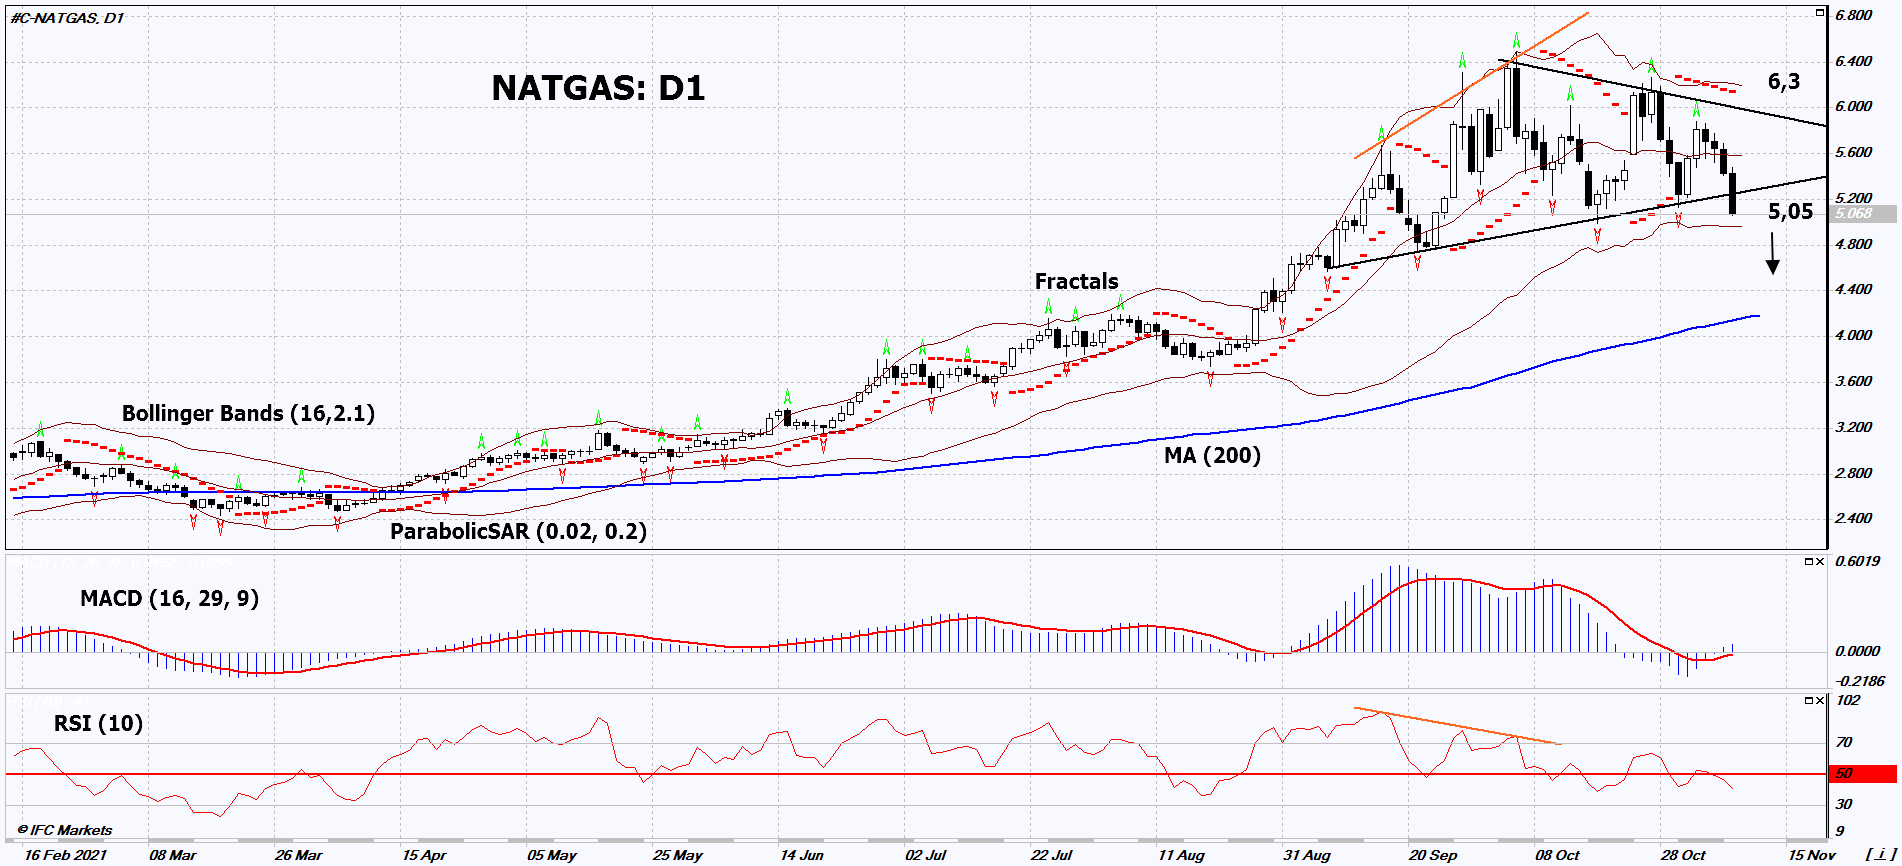
On the daily timeframe, NATGAS: D1 went down from the triangle. A number of technical analysis indicators have generated signals for further decline. We do not rule out a bearish movement if NATGAS: D1 falls below the last low: 5.05. This level can be used as an entry point. The initial risk limitation is possible above the last 2 upper fractals of the upper Bollinger band and the Parabolic signal: 6.3. After opening a pending order, move the stop-loss to the next fractal maximum following the Bollinger and Parabolic signals. Thus, we change the potential profit/loss ratio in our favor. The most cautious traders, after making a deal, can go to the four-hour chart and set a stop-loss, moving it in the direction of movement. If the price overcomes the stop level (6.3) without activating the order (5.05), it is recommended to delete the order: there are internal changes in the market that were not taken into account.
Fundamental Analysis of Commodities - Natural Gas
The Russian company Gazprom announced the readiness of Nord Stream 2 gas pipeline for the start of natural gas supplies to Germany. Will the NATGAS quotes continue to decline?
The Russian exporter of natural gas, Gazprom, has announced its readiness to launch the Nord Stream 2 gas pipeline designed to export gas from Russia to Europe. As a reminder, the construction of the new gas pipeline was completed on September 10, 2021. It connects Russia and Germany and consists of two pipes with a total capacity of 55 billion cubic meters of gas per year. The first pipe is already filled with technical gas and can be used. The delay in the commissioning of Nord Stream 2 is related to the problems of its certification in the Federal Network Agency of Germany (Bundesnetzagentur). Previously, it led to a powerful increase in natural gas prices. The supply of additional volumes of Russian pipeline gas to European countries could reduce the demand for American liquefied gas. Another negative factor may be the reduction in gas consumption in the United States. According to the U.S. Energy Information Administration (EIA), in October it averaged 71.8 Bcfd (billion cubic feet per day), up from 75 Bcfd on average in the 3rd quarter. The decline was mainly due to a decrease in electricity generation from US gas-fired power plants. With regard to the situation in Europe, EIA noted that European gas storage facilities in October this year were filled only by 77%. This is noticeably less than last year's 95% level and the 5-year average of 91%. Small gas reserves have become the main factor behind the rise in gas prices in Europe. The EIA predicts that average Henry Hub spot gas quotes from November to February will be $ 5.53/MMBtu and will decline to $ 3.93/MMBtu on average for the entire 2022. Such a drop may be due to an increase in gas production in the United States and a slowdown in the growth of export volumes of liquefied natural gas (LNG).
Explore our
Trading Conditions
- Spreads from 0.0 pip
- 30,000+ Trading Instruments
- Stop Out Level - Only 10%
Ready to Trade?
Open Account Note:
This overview has an informative and tutorial character and is published for free. All the data, included in the overview, are received from public sources, recognized as more or less reliable. Moreover, there is no guarantee that the indicated information is full and precise. Overviews are not updated. The whole information in each overview, including opinion, indicators, charts and anything else, is provided only for familiarization purposes and is not financial advice or а recommendation. The whole text and its any part, as well as the charts cannot be considered as an offer to make a deal with any asset. IFC Markets and its employees under any circumstances are not liable for any action taken by someone else during or after reading the overview.

