- Analytics
- Technical Analysis
NASDAQ 100 Technical Analysis - NASDAQ 100 Trading: 2019-03-14
Positive data bullish for Nd100
US retail sales and durable goods orders were better than expected. Will the Nd100 continue the rebound?
US economic releases after unexpectedly weak February jobs report were positive indicating the US economy remains strong. Durable goods orders recorded 0.4% over month increase in January when a 0.4% decline was forecast. Construction spending increase in January was also above forecast. The consumer price index rose 0.2% on month in February following three months of no change. A day before inflation data the Census Bureau reported above expected 0.2% rise over month in retail sales in January, after downwardly revised 1.6% drop in December. Better than expected economic data are bullish for Nd100 US stock index.
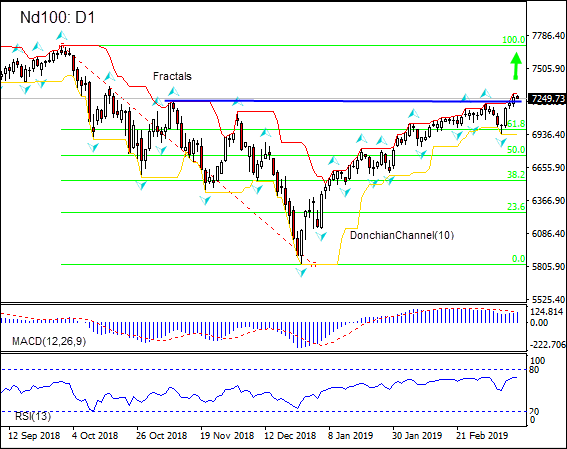
On the daily timeframe the Nd100: D1 has breached above the resistance line and has been rising after testing the Fibonacci 61.8 level. These are bullish.
- The Donchian channel indicates no trend yet: it is flat.
- The MACD indicator gives a bullish signal: it is above the signal line and the gap is widening.
- The RSI oscillator is rising but has not reached the overbought zone yet.
We believe the bullish momentum will continue after the price closes above the upper boundary of Donchian channel at 7292.22. This level can be used as an entry point for placing a pending order to buy. The stop loss can be placed below the fractal low at 6933.76. After placing the order, the stop loss is to be moved every day to the next fractal low. Thus, we are changing the expected profit/loss ratio to the breakeven point. If the price meets the stop loss level (6933.76) without reaching the order (7292.22), we recommend cancelling the order: the market has undergone internal changes which were not taken into account.
Technical Analysis Summary
| Position | Buy |
| Buy stop | Above 7292.22 |
| Stop loss | Below 6933.76 |
Explore our
Trading Conditions
- Spreads from 0.0 pip
- 30,000+ Trading Instruments
- Stop Out Level - Only 10%
Ready to Trade?
Open Account Note:
This overview has an informative and tutorial character and is published for free. All the data, included in the overview, are received from public sources, recognized as more or less reliable. Moreover, there is no guarantee that the indicated information is full and precise. Overviews are not updated. The whole information in each overview, including opinion, indicators, charts and anything else, is provided only for familiarization purposes and is not financial advice or а recommendation. The whole text and its any part, as well as the charts cannot be considered as an offer to make a deal with any asset. IFC Markets and its employees under any circumstances are not liable for any action taken by someone else during or after reading the overview.
