- Analytics
- Technical Analysis
Japan 225 Technical Analysis - Japan 225 Trading: 2017-08-25
Weak data are bearish for Nikkei
Falling trade surplus and weaker private investment expectations are bearish for Nikkei. Will NIKKEI continue falling?
Japan's economy expanded 2% on year in second quarter, accelerating from 1.5% growth in first three months of 2017. While the main contributor to the growth was stronger private consumption, recent weak wage growth provides little hope for sustained increase in consumption through higher private demand. As weak earnings growth highlights risks to continued economic expansion trade surplus continued to narrow in July: the trade surplus narrowed from JPY 440 billion in June to JPY 419 billion in July 2017 as imports increased more than exports. At the same time stronger yen and rising US protectionism spur concerns about Japan’s export outlook. And declining core machinery orders in June for third month consecutively signal weaker private investment. Weak external sector earnings and private investment expectations as weak wage growth makes sustained growth in private consumption unlikely is bearish spending.
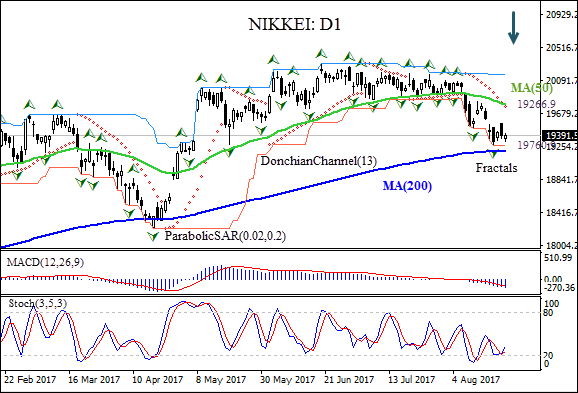
On the daily chart the NIKKEI: D1 has been falling last couple of weeks after trading in narrow range since the beginning of June. The price has fallen below the 50-day moving average MA(50) toward the 200-day moving average MA(200) .
- The Donchian channel indicates no downtrend yet: it is flat.
- The Parabolic indicator gives a sell signal.
- The MACD indicator is below the signal line and the gap is widening, which is a bearish signal.
- The stochastic oscillator is rising bust has not reached the overbought zone.
We believe the bearish momentum will continue after the price closes below the lower Donchian bound at 19266.90, confirmed also by fractal low. A pending order to sell can be placed below that level. The stop loss can be placed at Parabolic signal at 19760.90. After placing the pending order the stop loss is to be moved every day to the next fractal low, following Parabolic signals. Thus, we are changing the probable profit/loss ratio to the breakeven point. More conservative traders can switch to the 4-hour chart and move the stop-loss in the direction of the trade. If the price meets the stop loss level (19760.90) without reaching the order(19266.90), we recommend cancelling the position: the market sustains internal changes which were not considered.
Technical Analysis Summary
| Position | Sell |
| Sell stop | Below 19266.90 |
| Stop loss | Above 19760.90 |
Explore our
Trading Conditions
- Spreads from 0.0 pip
- 30,000+ Trading Instruments
- Stop Out Level - Only 10%
Ready to Trade?
Open Account Note:
This overview has an informative and tutorial character and is published for free. All the data, included in the overview, are received from public sources, recognized as more or less reliable. Moreover, there is no guarantee that the indicated information is full and precise. Overviews are not updated. The whole information in each overview, including opinion, indicators, charts and anything else, is provided only for familiarization purposes and is not financial advice or а recommendation. The whole text and its any part, as well as the charts cannot be considered as an offer to make a deal with any asset. IFC Markets and its employees under any circumstances are not liable for any action taken by someone else during or after reading the overview.
