- Analytics
- Technical Analysis
NZD/USD Technical Analysis - NZD/USD Trading: 2018-09-19
Preparing for the publication of significant statistics in New Zealand
The currency of New Zealand has slowed the decline in anticipation of important economic data. Will there be an upward correction of the NZDUSD?
The current account balance of New Zealand for the 2nd quarter of the current year will be published on September 19, 2018, and the GDP – on September 20. Market participants expect a small increase in the negative balance of the current account with a simultaneous growth of the economy by 2.5-2.7% year over year. In general, preliminary forecasts are good. The halting of the New Zealand Dollar decline occurred amid the publication of a positive PMI manufacturing index for August on September 14, 2018, as well as due to the easing of the US-China trade war tensions and progress in making a new US, Canada and Mexico foreign trade agreement. The next meeting of the Reserve Bank of New Zealand (RBNZ) will be held on September 26, as well as the trade balance for August will be published. These events can affect the foreign exchange market dynamics. Market participants expect that the RBNZ will keep the rate at the current historical low of 1.75%. Theoretically, its representatives can note the possibility of its growth in the future. At the peak of the 2008 crisis, the RBNZ rate reached 8.25%.
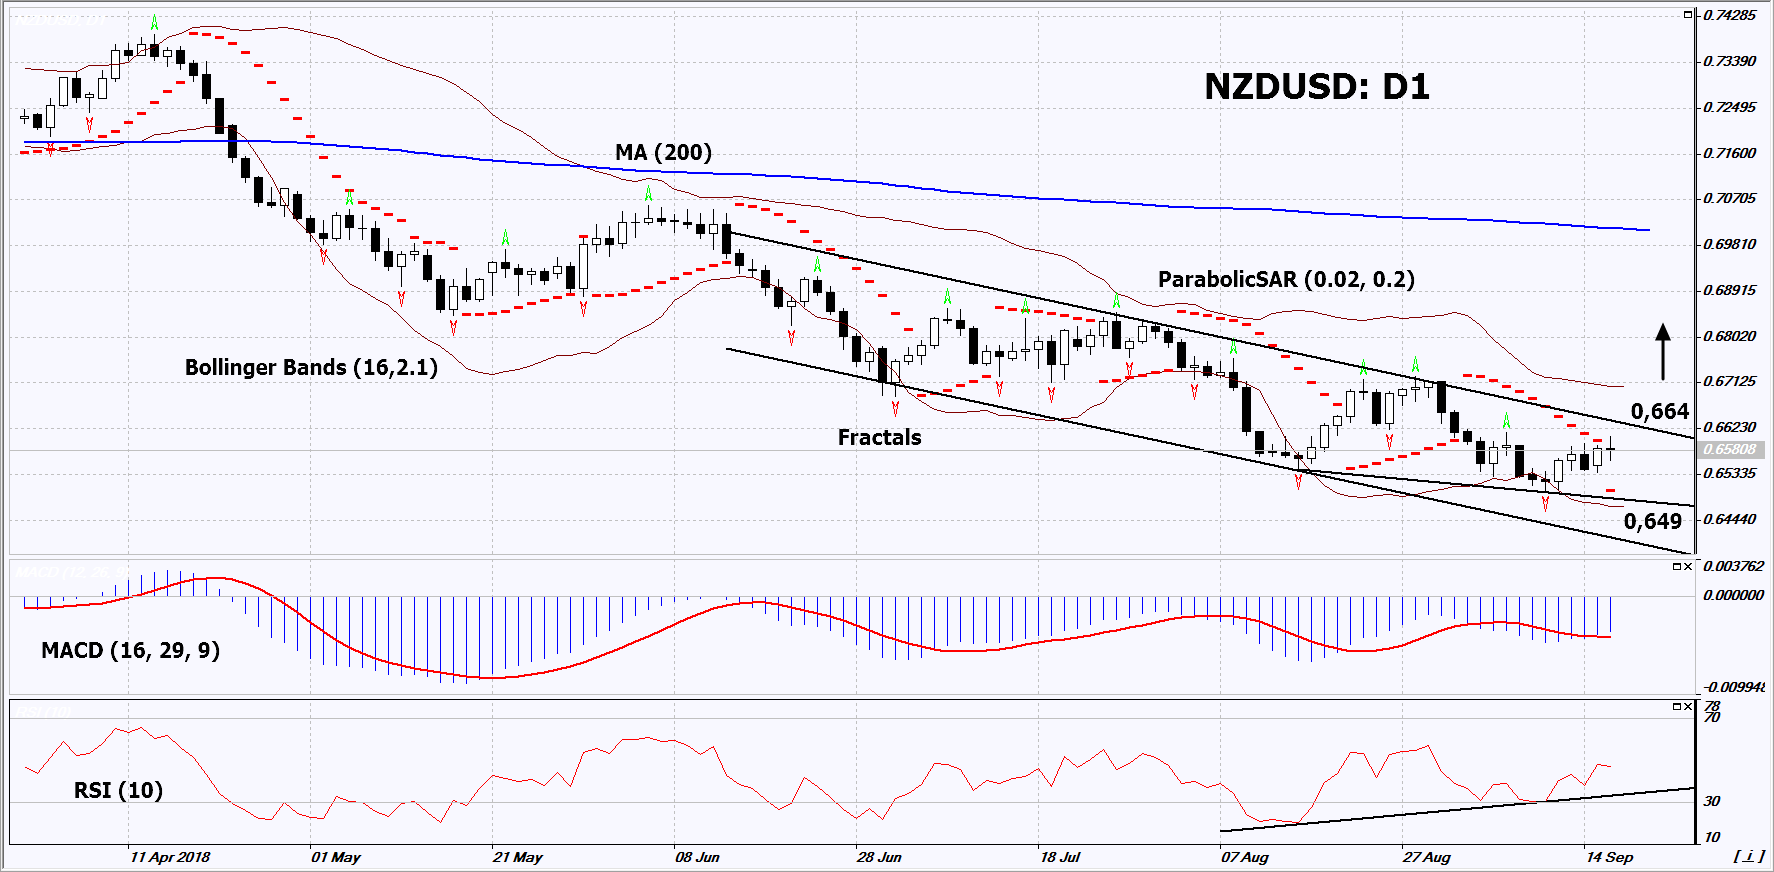
On the daily timeframe, NZDUSD: D1 has updated the low since January 2016 and is trying to correct up. A number of technical analysis indicators formed buy signals. The further price increase is possible in case of the publication of positive economic data.
- The Parabolic indicator gives a bullish signal.
- The Bollinger bands have widened, which indicates high volatility. They are titled upward.
- The RSI indicator is below 50. It has formed a positive divergence.
- The MACD indicator gives a bullish signal.
The bullish momentum may develop in case NZDUSD exceeds its last fractal high and the resistance line of the falling channel at 0.664. This level may serve as an entry point. The initial stop loss may be placed below the last fractal low, the 32-month low (since January 2016) and the Parabolic signal at 0.649. After opening the pending order, we shall move the stop to the next fractal low following the Bollinger and Parabolic signals. Thus, we are changing the potential profit/loss to the breakeven point. More risk-averse traders may switch to the 4-hour chart after the trade and place there a stop loss moving it in the direction of the trade. If the price meets the stop level (0.649) without reaching the order (0.664), we recommend to close the position: the market sustains internal changes that were not taken into account.
Summary of technical analysis
| Position | Buy |
| Buy stop | Above 0.664 |
| Stop loss | Below 0.649 |
- Get Certificate

Note:
This overview has an informative and tutorial character and is published for free. All the data, included in the overview, are received from public sources, recognized as more or less reliable. Moreover, there is no guarantee that the indicated information is full and precise. Overviews are not updated. The whole information in each overview, including opinion, indicators, charts and anything else, is provided only for familiarization purposes and is not financial advice or а recommendation. The whole text and its any part, as well as the charts cannot be considered as an offer to make a deal with any asset. IFC Markets and its employees under any circumstances are not liable for any action taken by someone else during or after reading the overview.
