- Analytics
- Technical Analysis
OATS Technical Analysis - OATS Trading: 2019-08-02
Higher export expectations bearish for oats
USDA forecasts increased Canadian oats exports to the United States. Will the oats prices continue declining?
The US Department of Agriculture forecast 20 percent expansion in global oats trade by 2019/20, due almost entirely an increase in Canadian exports to the United States. Canada now supplies 95 percent of total oats imports for the United States, according to Grain: World Markets and Trade report of USDA. As a result of uncertainty in rapeseed trade with China, some growers have shifted away from rapeseed to grow more barley and oats. And a jump in Canadian oats production and subsequent expansion in exports will go to US market in the south. Higher supply estimates are bearish for oats.
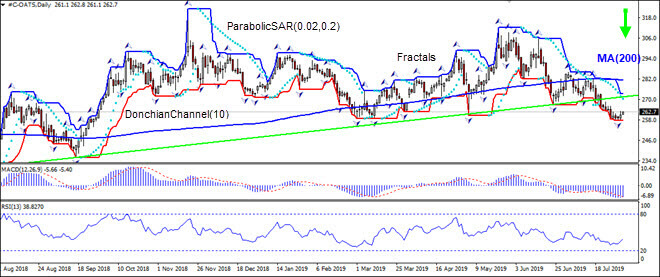
On the daily timeframe the OATS: D1 is below the 200-day moving average MA(200) which is declining .
- The Parabolic indicator gives a sell signal.
- The Donchian channel indicates no trend yet: it is flat.
- The MACD indicator gives a bullish signal: it is below the signal line and the gap is narrowing.
- The RSI oscillator is rising but is below the 50 level.
We believe the bearish momentum will continue after the price breaches below the lower boundary of Donchian channel at 257.4. This level can be used as an entry point for placing a pending order to sell. The stop loss can be placed above the upped Donchian boundary at 273.1. After placing the order, the stop loss is to be moved every day to the next fractal high, following Parabolic signals. Thus, we are changing the expected profit/loss ratio to the breakeven point. If the price meets the stop loss level (273.1) without reaching the order (257.4), we recommend cancelling the order: the market has undergone internal changes which were not taken into account.
Technical Analysis Summary
| Order | Sell |
| Sell stop | Below 257.4 |
| Stop loss | Above 273.1 |
Explore our
Trading Conditions
- Spreads from 0.0 pip
- 30,000+ Trading Instruments
- Stop Out Level - Only 10%
Ready to Trade?
Open Account Note:
This overview has an informative and tutorial character and is published for free. All the data, included in the overview, are received from public sources, recognized as more or less reliable. Moreover, there is no guarantee that the indicated information is full and precise. Overviews are not updated. The whole information in each overview, including opinion, indicators, charts and anything else, is provided only for familiarization purposes and is not financial advice or а recommendation. The whole text and its any part, as well as the charts cannot be considered as an offer to make a deal with any asset. IFC Markets and its employees under any circumstances are not liable for any action taken by someone else during or after reading the overview.
