- Analytics
- Technical Analysis
Natural Gas vs Oil Technical Analysis - Natural Gas vs Oil Trading: 2019-05-01
Preparing for the publication of data on US oil reserves
In this review, we suggest considering the personal composite instrument (PCI) &SumOIL/GAS. It reflects the price dynamics of the portfolio composed of futures contracts on Brent and WTI crude oils against natural gas futures contract. Will the SumOIL/GAS decline?
Such a movement means that natural gas prices are rising, while oil prices are falling. On Monday, the cost of gas reached a 2-week high. Futures prices have been rising for the 5th day in a row for the first time since August 2018. This may become one of the signals of the reversal of the American natural gas market to the top. Since the end of November of the last year, its prices have fallen 2 times, and the personal composite instrument SumOIL / GAS has increased 2.4 times. Let us note that according to the latest data by the U.S. Energy Information Administration, current gas reserves in the US are 1.452 trillion. cubic feet. This is 18.3% less than the average 5-year level. Development projects of exports of liquefied gas from the United States may become important factors for an increase in demand for natural gas. Concerning world oil prices, it can be assumed that there are chances for the continuation of their downward correction, which emerged after US President Donald Trump's call on OPEC to increase production. After the reduction at the beginning of the year, it reached a 4-year low in April 2019. Theoretically, the US can soften sanctions against Iran and Venezuela. Weekly data on its reserves in the US, which will be released on Wednesday, May 1, may affect oil prices.
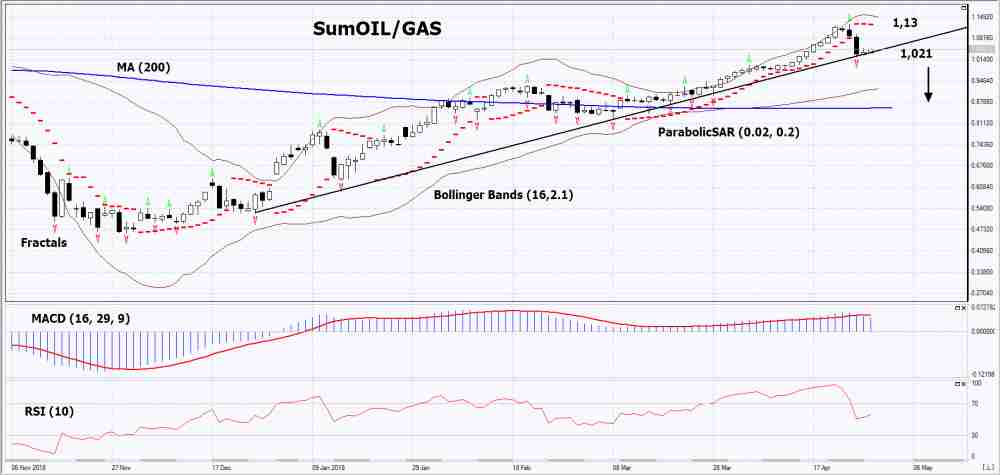
On the daily timeframe, SumOIL/GAS: D1 approached the support line of the uptrend. It should be breached down before opening a position. A number of technical analysis indicators formed sell signals. A price decrease is possible in case gas prices rise, and oil prices fall.
- The Parabolic Indicator gives a bearish signal.
- The Bollinger bands have widened, which indicates low volatility. The upper band is titled down.
- The RSI indicator is above 50. No divergence .
- The MACD indicator gives a bearish signal.
The bearish momentum may develop in case SumOIL/GAS falls below its last fractal low at 1.021. This level may serve as an entry point. The initial stop loss may be placed above the last fractal high, the maximum since November 2013 and the Parabolic signal at 1.13. After opening the pending order, we shall move the stop to the next fractal low following the Bollinger and Parabolic signals. Thus, we are changing the potential profit/loss to the breakeven point. More risk-averse traders may switch to the 4-hour chart after the trade and place there a stop loss moving it in the direction of the trade. If the price meets the stop level (1.13) without reaching the order (1.021), we recommend to close the position: the market sustains internal changes that were not taken into account.
Summary of technical analysis
| Position | Sell |
| Sell stop | Below 1.021 |
| Stop loss | Above 1.13 |
Explore our
Trading Conditions
- Spreads from 0.0 pip
- 30,000+ Trading Instruments
- Stop Out Level - Only 10%
Ready to Trade?
Open Account Note:
This overview has an informative and tutorial character and is published for free. All the data, included in the overview, are received from public sources, recognized as more or less reliable. Moreover, there is no guarantee that the indicated information is full and precise. Overviews are not updated. The whole information in each overview, including opinion, indicators, charts and anything else, is provided only for familiarization purposes and is not financial advice or а recommendation. The whole text and its any part, as well as the charts cannot be considered as an offer to make a deal with any asset. IFC Markets and its employees under any circumstances are not liable for any action taken by someone else during or after reading the overview.
