- Analytics
- Technical Analysis
Orange Juice Technical Analysis - Orange Juice Trading: 2019-01-28
A reduction in orange yield is expected in Brazil
The Cepea agency expects a 30% reduction in shipment volumes of oranges from Brazil in the 2018/19 agricultural season. Will orange prices rise?
It should be noted that since mid-July 2018, frozen orange juice prices have fallen by about a third. This was due to the positive outlook by the US Department of Agriculture to increase the yield of oranges in Florida in the 2018/19 season by 71.5% compared with the previous season, which turned out to be the worst since 1944/45. In the current season, a decline in citrus production is observed in São Paulo and Triângulo Mineiro because of the bad weather and lack of investments. Perhaps this will be a factor for the correction of quotations upwards after their strong decline. Another positive moment may be the forecast of Transparency Market Research on the increase in the global market of fruit juice concentrates by 31% by 2025 compared with 2017. According to this organization, the global growth in demand will be due to the propagation of a healthy lifestyle in countries with growing economies. Orange juice has the biggest share in the global juice market, about 36%.
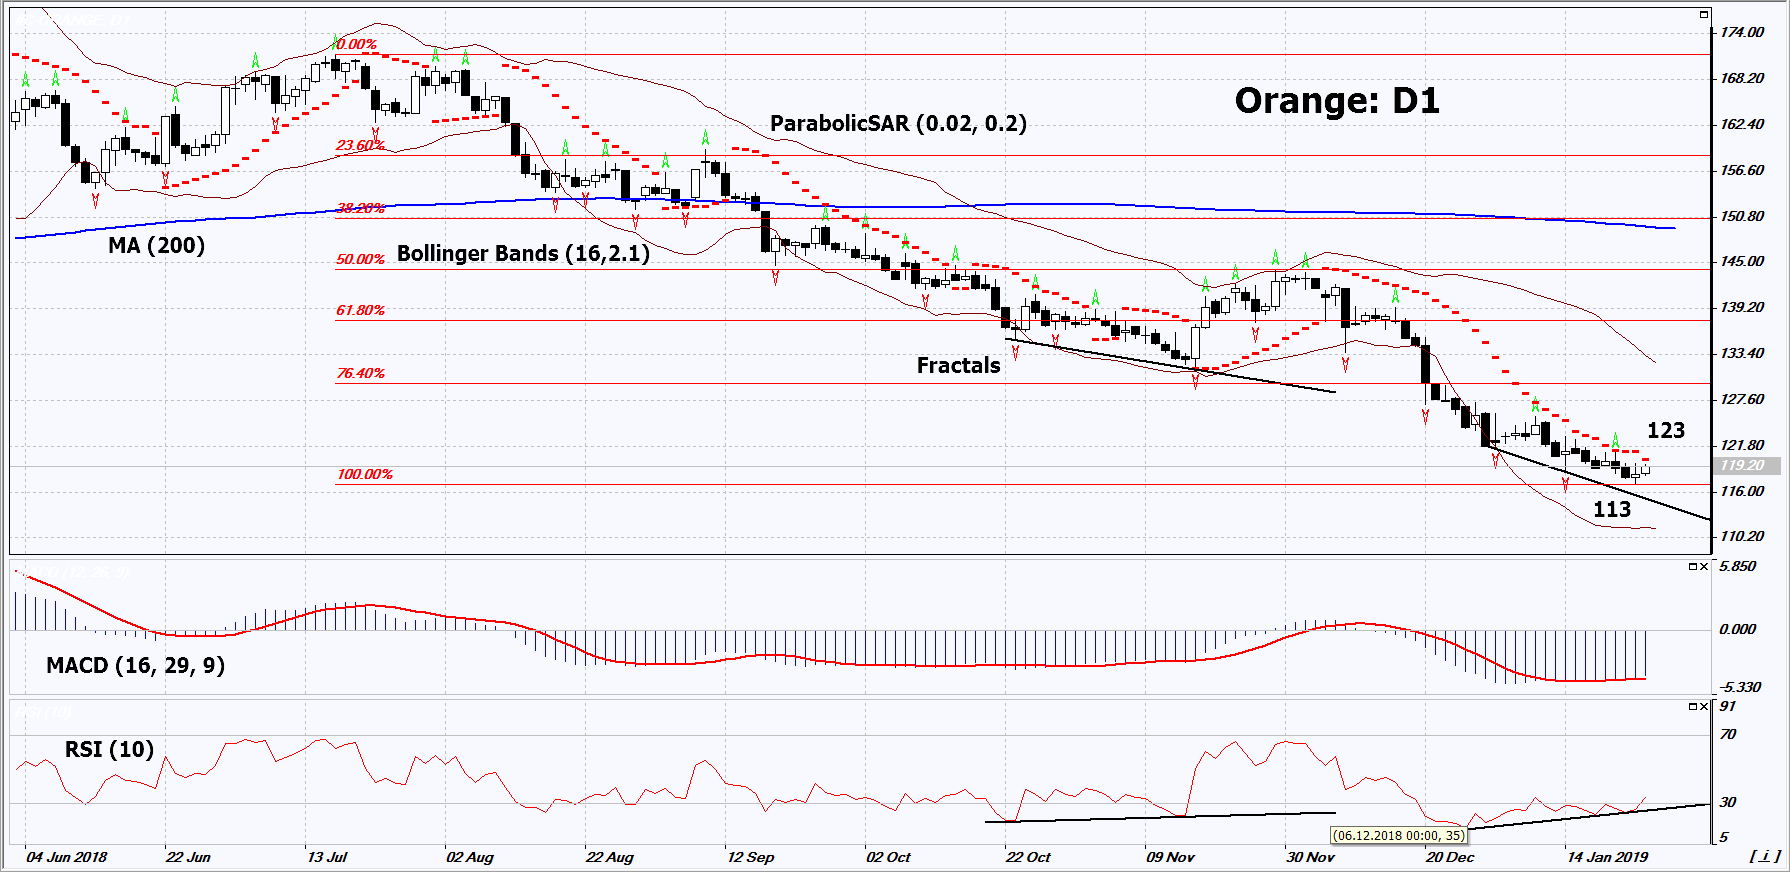
On the daily timeframe, Orange: D1 is in a downtrend. At the same time, its decline has slowed down and a number of technical analysis indicators have formed buy signals. The further price increase is possible in case of a decrease in the yield in Brazil and preservation of high demand.
- The Parabolic indicator gives a bearish signal.
- The Bollinger bands have widened, which indicates high volatility. The lower Bollinger band is titled upwards.
- The RSI indicator is near 50. It has formed a positive divergence.
- The MACD indicator gives a bullish signal.
The bullish momentum may develop in case Orange exceeds the last fractal high and the Parabolic signal at 123. This level may serve as an entry point. The initial stop loss may be placed below the last low (over 3 years) at 113. After opening the pending order, we shall move the stop to the next fractal low following the Bollinger and Parabolic signals. Thus, we are changing the potential profit/loss to the breakeven point. More risk-averse traders may switch to the 4-hour chart after the trade and place there a stop loss moving it in the direction of the trade. If the price meets the stop level (113) without reaching the order (123), we recommend to close the position: the market sustains internal changes that were not taken into account.
Summary of technical analysis
| Position | Buy |
| Buy stop | Above 123 |
| Stop loss | Below 113 |
- Get Certificate

Note:
This overview has an informative and tutorial character and is published for free. All the data, included in the overview, are received from public sources, recognized as more or less reliable. Moreover, there is no guarantee that the indicated information is full and precise. Overviews are not updated. The whole information in each overview, including opinion, indicators, charts and anything else, is provided only for familiarization purposes and is not financial advice or а recommendation. The whole text and its any part, as well as the charts cannot be considered as an offer to make a deal with any asset. IFC Markets and its employees under any circumstances are not liable for any action taken by someone else during or after reading the overview.
