- Analytics
- Technical Analysis
Rice Investments Technical Analysis - Rice Investments Trading: 2019-05-06
Two major rice producers cut exports
Vietnam and India have reduced the rice export. Will the quotations grow?
India reduced rice exports in the agricultural season 2018/19 by 7.2% compared with the previous season - to 11.95 million tons. In January-April 2019, Vietnam reduced rice exports by 7.9% compared to the same period in 2018 to 2 million tons. Note that India and Vietnam are the 1st and 3rd place in the world in the export of rice, and the 2nd place is Thailand.
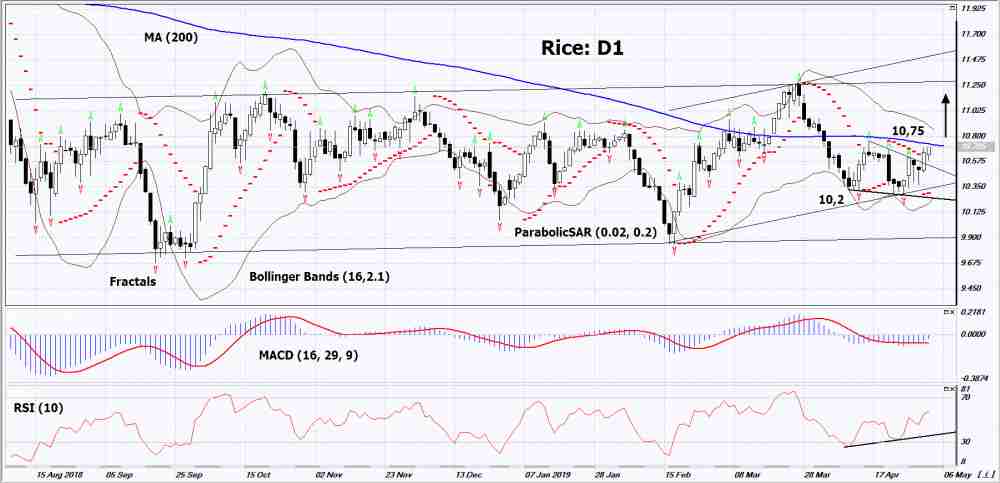
On the daily timeframe , Rice: D1 is in the medium neutral trend. It is moving towards the upper limit and various technical analysis indicators formed an uptrend signal. Further growth of quotations is possible in case of a further reduction in world exports.
- The Parabolic indicator has formed a buy signal.
- The Bollinger Bands narrowed, which indicates volatility decrease. The bottom line of Bollinger has a slope up.
- The RSI indicator is above the 50 mark. It has formed a divergence to the rise.
- The MACD indicator gives a signal to increase.
The bullish momentum may develop if Rice exceeds the 200-day moving average line and the last 3 upper fractals: 10.75. This level may serve as an entry point. The initial stop loss may be placed below the Parabolic signal, the last 2 lower fractals and the bottom Bollinger line: 10.2. After the opening the pending order, we shall move the stop following the Bollinger Bands and Parabolic to the next fractal minimum. Thus, we are changing the potential profit/loss to the breakeven point. More risk-averse traders may switch to the 4-hour chart after the trade and place there a stop loss moving it in the direction of the trade. In case if the price meets the stop level (10,2) without reaching the order (10,75), we recommend to close the position: the market sustains internal changes that were not taken into account.
Technical Analysis Summary
| Position | Buy |
| Buy stop | Above 10,75 |
| Stop loss | Below 10,2 |
Explore our
Trading Conditions
- Spreads from 0.0 pip
- 30,000+ Trading Instruments
- Stop Out Level - Only 10%
Ready to Trade?
Open Account Note:
This overview has an informative and tutorial character and is published for free. All the data, included in the overview, are received from public sources, recognized as more or less reliable. Moreover, there is no guarantee that the indicated information is full and precise. Overviews are not updated. The whole information in each overview, including opinion, indicators, charts and anything else, is provided only for familiarization purposes and is not financial advice or а recommendation. The whole text and its any part, as well as the charts cannot be considered as an offer to make a deal with any asset. IFC Markets and its employees under any circumstances are not liable for any action taken by someone else during or after reading the overview.
