- Analytics
- Technical Analysis
Soybean Trade Technical Analysis - Soybean Trade Trading: 2015-10-02
Grain Stocks report supports soybean prices
US Department of Agriculture lowered soybean stocks in its quarterly grain stocks report on Wednesday. The report supported soybean prices. Will the price of soybean continue rising after the report?
The Grain Stocks quarterly report released on Wednesday indicated the US Department of Agriculture lowered the soybean carryover stocks to about 191 million bushels from the 2014-2015 expected carryover of 205 million bushels. The figure was lower than the 210 million bushels soybean ending stocks the agency projected for 2014-2015 in its World Agricultural Supply and Demand Estimate in September. Experts note also that the change was the result of lowered yield for last year crop, and point to possibility that the yield this year may also turn out to be lower as it is just below last year’s yield. Both factors boosted the price of soybean.
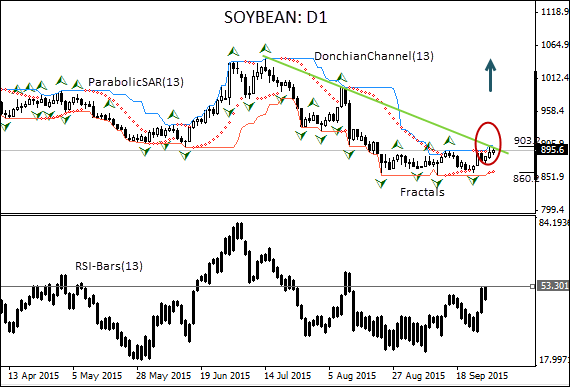
The soybean price has been falling from mid-July after forming a double top pattern on the daily timeframe. It is about to break above the resistance line. The parabolic indicator has formed a buy signal. The Donchian channel is tilted upward. The RSI-Bars oscillator is also rising and hasn’t reached the overbought zone yet. We believe the bullish momentum will continue after the price closes above the resistance line and upper Donchian channel at 903.2. A pending order to buy can be placed above that level. The stop loss can be placed below the last fractal low at 860.2. After placing the pending order the stop loss is to be moved every day to the next fractal low, following Parabolic signals. Thus, we are changing the probable profit/loss ratio to the breakeven point. If the price meets the stop loss level without reaching the order, we recommend cancelling the position: the market sustains internal changes which were not considered.
| Position | Buy |
| Buy stop | above 903.2 |
| Stop loss | below 860.2 |
- Get Certificate

Note:
This overview has an informative and tutorial character and is published for free. All the data, included in the overview, are received from public sources, recognized as more or less reliable. Moreover, there is no guarantee that the indicated information is full and precise. Overviews are not updated. The whole information in each overview, including opinion, indicators, charts and anything else, is provided only for familiarization purposes and is not financial advice or а recommendation. The whole text and its any part, as well as the charts cannot be considered as an offer to make a deal with any asset. IFC Markets and its employees under any circumstances are not liable for any action taken by someone else during or after reading the overview.
