- Analytics
- Technical Analysis
Soybean Trade Technical Analysis - Soybean Trade Trading: 2019-04-10
Soybean reserves may decline in the US
The U.S. Department of Agriculture (USDA) lowered the forecast for US soybean reserves at the end of the 2018/19 agricultural season by 5 million bushels. Will Soyb prices rise?
In the April USDA review, the forecast for US reserves was lowered to 895 million bushels from 900 million bushels in the March review. The world soybean consumption in the 2018/19 season will amount to 349.1 million tons, which is 3.1% more than in the 2017/18 season. At the same time, an increase in world production by 5.3% to 360.1 million tons is expected. The difference will go to world reserves. The largest increase in soybean crop is expected in Latin America. Accordingly, prices may strongly depend on the weather in the region. The main factor for the possible increase in soybean prices is the mitigation of trade disputes between the US and China. At the end of January, China agreed to purchase 5 million tons of American soybeans this year and can significantly increase this volume. The next round of the US-China trade talks took place last week. US President Donald Trump stated that he asked China to abolish all duties on American agricultural products. Trump expects a conclusion of the trade agreement with China in the next 4 weeks.
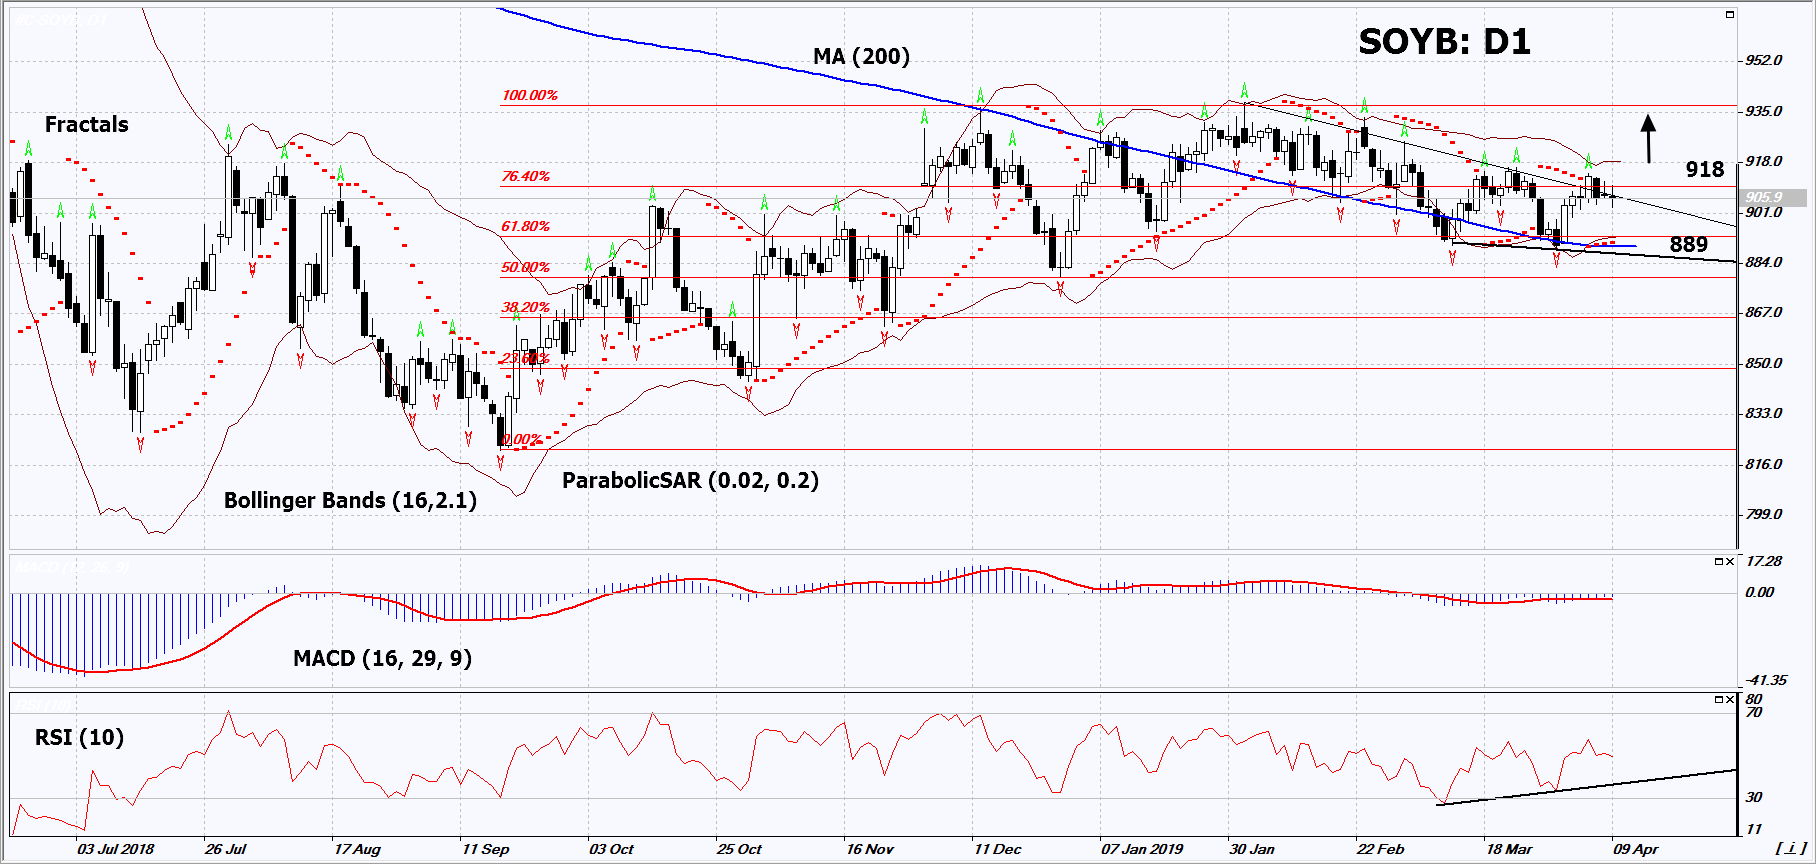
On the daily timeframe, Soyb: D1 approached the resistance line of the downward channel. Before opening a buy position, it should be breached up. A number of technical analysis indicators formed buy signals. The further price increase is possible in case of a reduction in world harvest and resumption of US soybean imports to China.
- The Parabolic Indicator gives a bullish signal.
- The Bollinger bands have narrowed, which indicates low volatility. Both Bollinger bands are titled upward.
- The RSI indicator is below 50. It has formed a positive divergence.
- The MACD indicator gives a bullish signal.
The bullish momentum may develop in case Soyb exceeds its three last fractals and the upper Bollinger band at 918. This level may serve as an entry point. The initial stop loss may be placed below the last fractal low, the lower Bollinger band, the 200-day moving average line and the Parabolic signal at 889. After opening the pending order, we shall move the stop to the next fractal low following the Bollinger and Parabolic signals. Thus, we are changing the potential profit/loss to the breakeven point. More risk-averse traders may switch to the 4-hour chart after the trade and place there a stop loss moving it in the direction of the trade. If the price meets the stop level (889) without reaching the order (918), we recommend to close the position: the market sustains internal changes that were not taken into account.
Summary of technical analysis
| Position | Buy |
| Buy stop | Above 918 |
| Stop loss | Below 889 |
Explore our
Trading Conditions
- Spreads from 0.0 pip
- 30,000+ Trading Instruments
- Stop Out Level - Only 10%
Ready to Trade?
Open Account Note:
This overview has an informative and tutorial character and is published for free. All the data, included in the overview, are received from public sources, recognized as more or less reliable. Moreover, there is no guarantee that the indicated information is full and precise. Overviews are not updated. The whole information in each overview, including opinion, indicators, charts and anything else, is provided only for familiarization purposes and is not financial advice or а recommendation. The whole text and its any part, as well as the charts cannot be considered as an offer to make a deal with any asset. IFC Markets and its employees under any circumstances are not liable for any action taken by someone else during or after reading the overview.
