- Analytics
- Technical Analysis
Soybean Meal Technical Analysis - Soybean Meal Trading: 2017-04-12
Flooding in Argentina may delay harvesting
Storms, floods and rains in the western part of Argentina may delay harvesting of soy crops in 2016/17 agricultural season. Will the prices of soybean meal rise?
Argentina is the 3rd largest soybean producer in the world. According to forecasts, its soy crop should be 56.5 mln tonnes. Currently, only 5.9% of planted area is harvested. Previously, soy prices have been declining for 5 straight weeks, for the first time in the last 30 months. Another factor which may support prices is the upward revision of the Chinese Ministry of Agriculture forecasts. The soybean imports to China may increase to 86.55 mln tonnes in 2016/17 season from the previously expected 85.31 mln tonnes. The soybean consumption may rise to 100.81 mln tonnes from 99.87 mln tonnes. Note, that on Tuesday, at 19-00 CET the review on grain crop and stocks will be released by the US Department of Agriculture (USDA). It may markedly impact the prices. The preliminary forecasts were rather optimistic, if they are revised down, it may disappoint market participants.
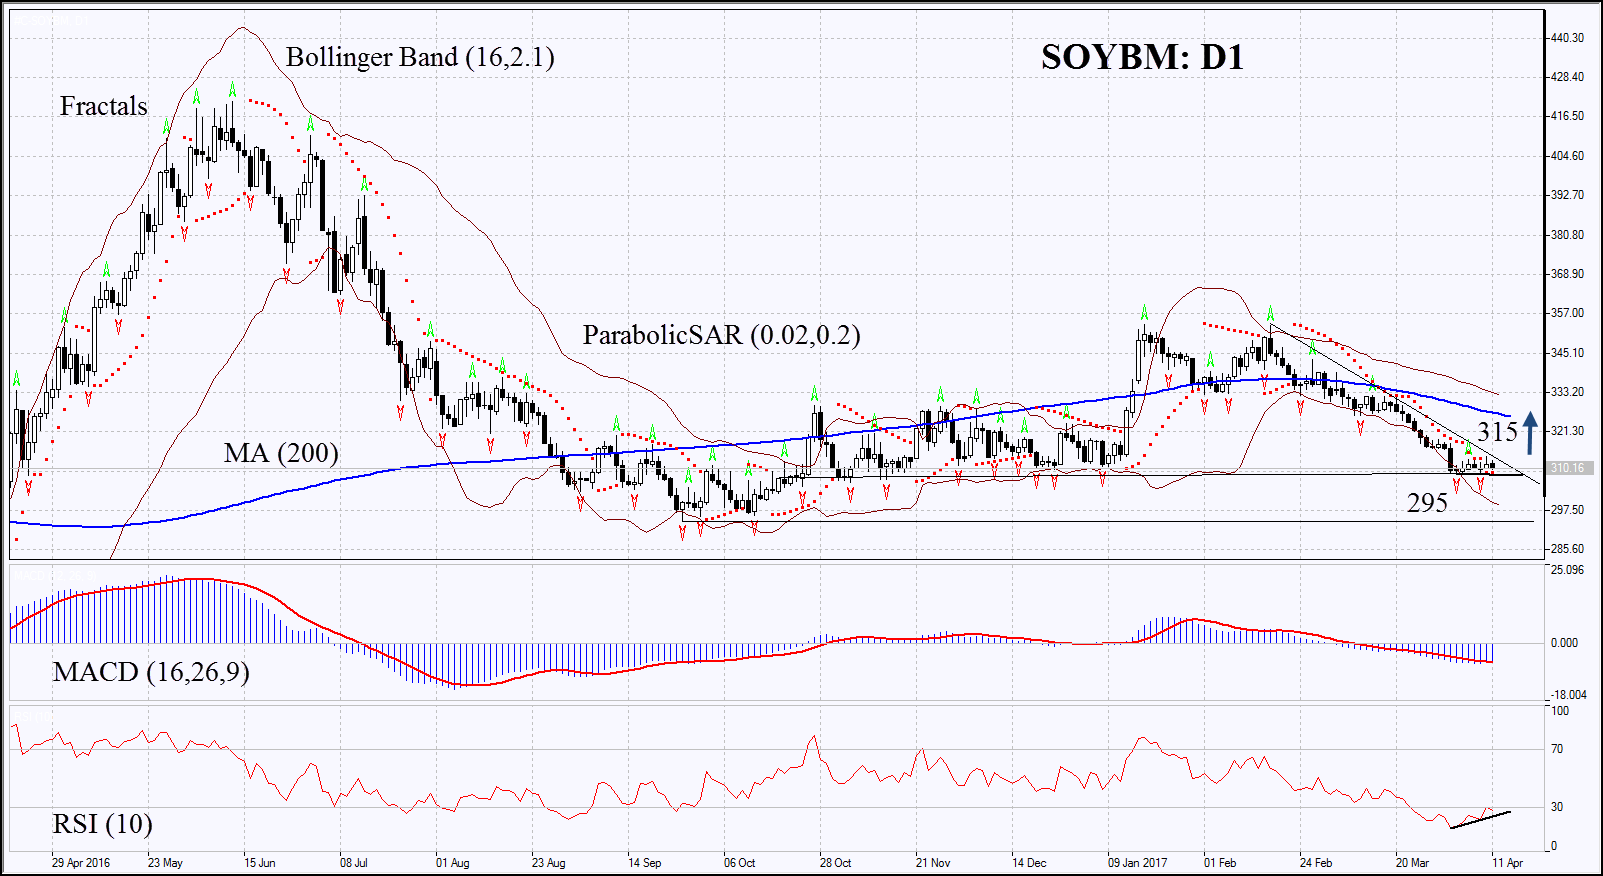
On the daily timeframe, SOYBM: D1 is in the downtrend. The bullish reversal of prices is possible in case of deterioration of weather conditions in Argentina and a decrease of the USDA forecasts.
- Parabolic indicator gives bullish signals.
- The Bollinger bands have widened, which means higher volatility.
- The RSI is in the oversold zone. It has formed a positive divergence.
- The MACD gives bullish signals.
The bullish momentum may develop in case SOYBM exceeds the last fractal high and the resistance line of the downtrend at 315. This level may serve as the entry point. The initial stop-loss may be placed below the Parabolic signal, the Bollinger bands and the annual low at 295. After opening the pending order, we shall move the stop to the next fractal low following the Bollinger and Parabolic signals. Thus, we are changing the potential profit/loss to the breakeven point. More risk-averse traders may switch to the 4-hour chart after the trade and place there a stop-loss moving it in the direction of the trade. If the price meets the stop level at 295 without reaching the order at 315 we recommend cancelling the position: the market sustains internal changes that were not taken into account.
Summary of technical analysis
| Position | Buy |
| Buy stop | 315 |
| Stop loss | 295 |
Explore our
Trading Conditions
- Spreads from 0.0 pip
- 30,000+ Trading Instruments
- Stop Out Level - Only 10%
Ready to Trade?
Open Account Note:
This overview has an informative and tutorial character and is published for free. All the data, included in the overview, are received from public sources, recognized as more or less reliable. Moreover, there is no guarantee that the indicated information is full and precise. Overviews are not updated. The whole information in each overview, including opinion, indicators, charts and anything else, is provided only for familiarization purposes and is not financial advice or а recommendation. The whole text and its any part, as well as the charts cannot be considered as an offer to make a deal with any asset. IFC Markets and its employees under any circumstances are not liable for any action taken by someone else during or after reading the overview.
