- Analytics
- Technical Analysis
USD/CAD Technical Analysis - USD/CAD Trading: 2015-09-09
Yet another Bank of Canada meeting
Yet another Bank of Canada meeting is to take place on Wednesday. The current rate of 0,5% is expected to be unchanged. Nevertheless, the statements made by officials after the meeting may influence the Canadian Dollar. Will it strengthen?
The Bank of Canada statement is expected at 16:00 CET on Wednesday. Most investors expect the rate is to remain at the current level till the 1st quarter of 2017. Later the rate hike is possible following the similar steps by the US Federal Reserve. The Canadian Dollar is presently on its 11-year high, which means its major weakening against the US currency for this period. The halving of the rate by the Bank of Canada in 2015 contributed to that. In theory, if the Bank renounces officially the further rate decline this may correct the Canadian Dollar exchange rate. Last week in Canada was released the good macroeconomic statistics to which the exchange rate was irresponsive. The GDP growth in June exceeded expectations. The negative trade balance narrowed in July. The August unemployment slightly increased from 6.8% to 7%, while the payrolls rose much more than expected. The next important data on the inflation in August in Canada is to come out on September 18.
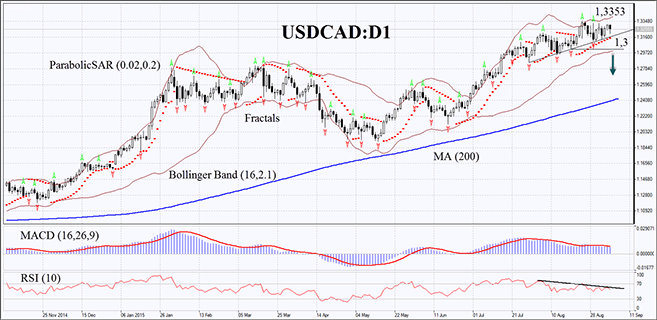
On the daily chart the USDCAD:D1 is consolidated remaining in the uptrend. It is far above its 200-day moving average. The Bollinger lines contracted which may signify the lower volatility. The Parabolic Indicator gives the buy signal while MACD is struggling to look down. The RSI has formed the negative divergence and came near to 50. The bearish trend is probable if the Canadian Dollar surpasses the Parabolic Indicator, the lower Bollinger Band and the fractal of 1.3. This level may be used for entering the market. The primary risk limit may be placed above the 11-year high of 1.3353. Having opened the delayed order, we shall move the stop to the next fractal high following the Bollinger and Parabolic signals every 4 hours. By doing this we adjust the potential profit/loss ratio in our favour. The most risk-averse traders may switch to the 4-hour chart after the trade and place there a stop-loss moving it in the direction of the trade. If the price meets the stop-loss level of 1.3353 without reaching the order of 1.3, we recommend cancelling the position: the market sustains internal changes which were not taken into account.
| Position | Sell |
| Sell stop | below 1,3 |
| Stop loss | above 1,3353 |
Explore our
Trading Conditions
- Spreads from 0.0 pip
- 30,000+ Trading Instruments
- Stop Out Level - Only 10%
Ready to Trade?
Open Account Note:
This overview has an informative and tutorial character and is published for free. All the data, included in the overview, are received from public sources, recognized as more or less reliable. Moreover, there is no guarantee that the indicated information is full and precise. Overviews are not updated. The whole information in each overview, including opinion, indicators, charts and anything else, is provided only for familiarization purposes and is not financial advice or а recommendation. The whole text and its any part, as well as the charts cannot be considered as an offer to make a deal with any asset. IFC Markets and its employees under any circumstances are not liable for any action taken by someone else during or after reading the overview.
