- Analytics
- Technical Analysis
USD/CAD Technical Analysis - USD/CAD Trading: 2017-02-03
Resumption of economic growth is bullish for Canadian dollar
Canadian GDP rose more than expected in November 2016, the fifth advance in six months. Will the Canadian dollar continue strengthening?
The Bank of Canada left the interest rate unchanged at 0.5% at January 18 policy meeting as the economy continued to operate with excess capacity. The central bank expects the Canadian economy will grow 2.1% in 2017 and 2018. The 0.4% rise in Canadian GDP in November was better than the 0.3% expected increase, and the fifth advance in the last six months with the year-on-year growth rate at 1.6%. At the same time the 0.3% October contraction reported previously was revised upward to a decline of 0.2%. This was a bullish development for Canadian dollar. Higher exports in November, which resulted in the first trade surplus since January 2016, and the surprisingly high number of new jobs added in Canadian economy in December also supported Canadian dollar. A sustained increase in oil prices, Canada’s main export energy commodity, and continued weakness of US dollar may provide further support for Canadian dollar. Next major economic data will be released on February 7 and 10 when the Balance of Trade for December and Unemployment Rate for January will be published.
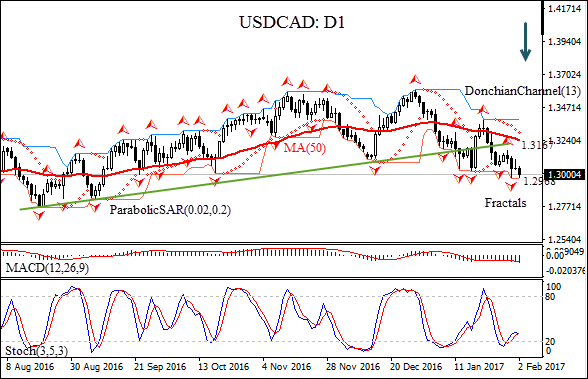
USDCAD: D1 has been trading with a negative bias on the daily timeframe since it hit a ten-month high in the end of December 2016. The price is below the 50-day moving average MA(50), which continues to decline.
- The Donchian channel gives a neutral signal: it is flat.
- The Parabolic indicator has formed a sell signal.
- The MACD indicator gives a bearish signal.
- The stochastic oscillator is turning lower but has not reached the oversold zone yet.
We expect the bearish momentum will continue after the price closes below the last fractal low at 1.2968, confirmed also by lower Donchian bound. It can be used as an entry point for a pending order to sell. The stop loss can be placed above the last fractal high at 1.3167. After placing the pending order the stop loss is to be moved to the next fractal high following Parabolic signals. Thus, we are changing the profit/loss ratio to the breakeven point. If the price meets the stop loss level (1.3167) without reaching the order (1.2968), we recommend cancelling the position: the market sustains internal changes which were not taken into account.
Technical Analysis Summary
| Position | Sell |
| Sell stop | Below 1.2968 |
| Stop loss | Above 1.3167 |
Explore our
Trading Conditions
- Spreads from 0.0 pip
- 30,000+ Trading Instruments
- Stop Out Level - Only 10%
Ready to Trade?
Open Account Note:
This overview has an informative and tutorial character and is published for free. All the data, included in the overview, are received from public sources, recognized as more or less reliable. Moreover, there is no guarantee that the indicated information is full and precise. Overviews are not updated. The whole information in each overview, including opinion, indicators, charts and anything else, is provided only for familiarization purposes and is not financial advice or а recommendation. The whole text and its any part, as well as the charts cannot be considered as an offer to make a deal with any asset. IFC Markets and its employees under any circumstances are not liable for any action taken by someone else during or after reading the overview.
