- Analytics
- Technical Analysis
USD/CAD Technical Analysis - USD/CAD Trading: 2017-02-15
Fed rate may by far surpass the rate of Bank of Canada
The Fed Chair Janet Yellen said on Tuesday that she may hike the rate at the forthcoming meetings. This triggered rally of US dollar index. In this report we will study the USDCAD chart. Will it advance?
Such a trend will mean weaker Canadian dollar against the US dollar. The current Bank of Canada’s rate is 0.5%. This is below the Fed Funds Target Rate of 0.75%. The difference is not to the advantage of Canada’s dollar. The further Fed rate hike may make the US dollar more appealing compared to the Canadian currency. The Deputy Governor of the Bank of Canada Lawrense Schembri said last week that the current interest rate in Canada is quite pertinent to support the national economic growth and may be left till mid-2018. In its turn, the next Fed meeting will take place on March 15, 2017 and then on May 3 and June 14. It’s quite hard to tell now at which one the rate may be hiked. This week the next significant economic data will come out in Canada on Wednesday only: sales of manufacturing production for December. The tentative outlook is negative in our opinion.
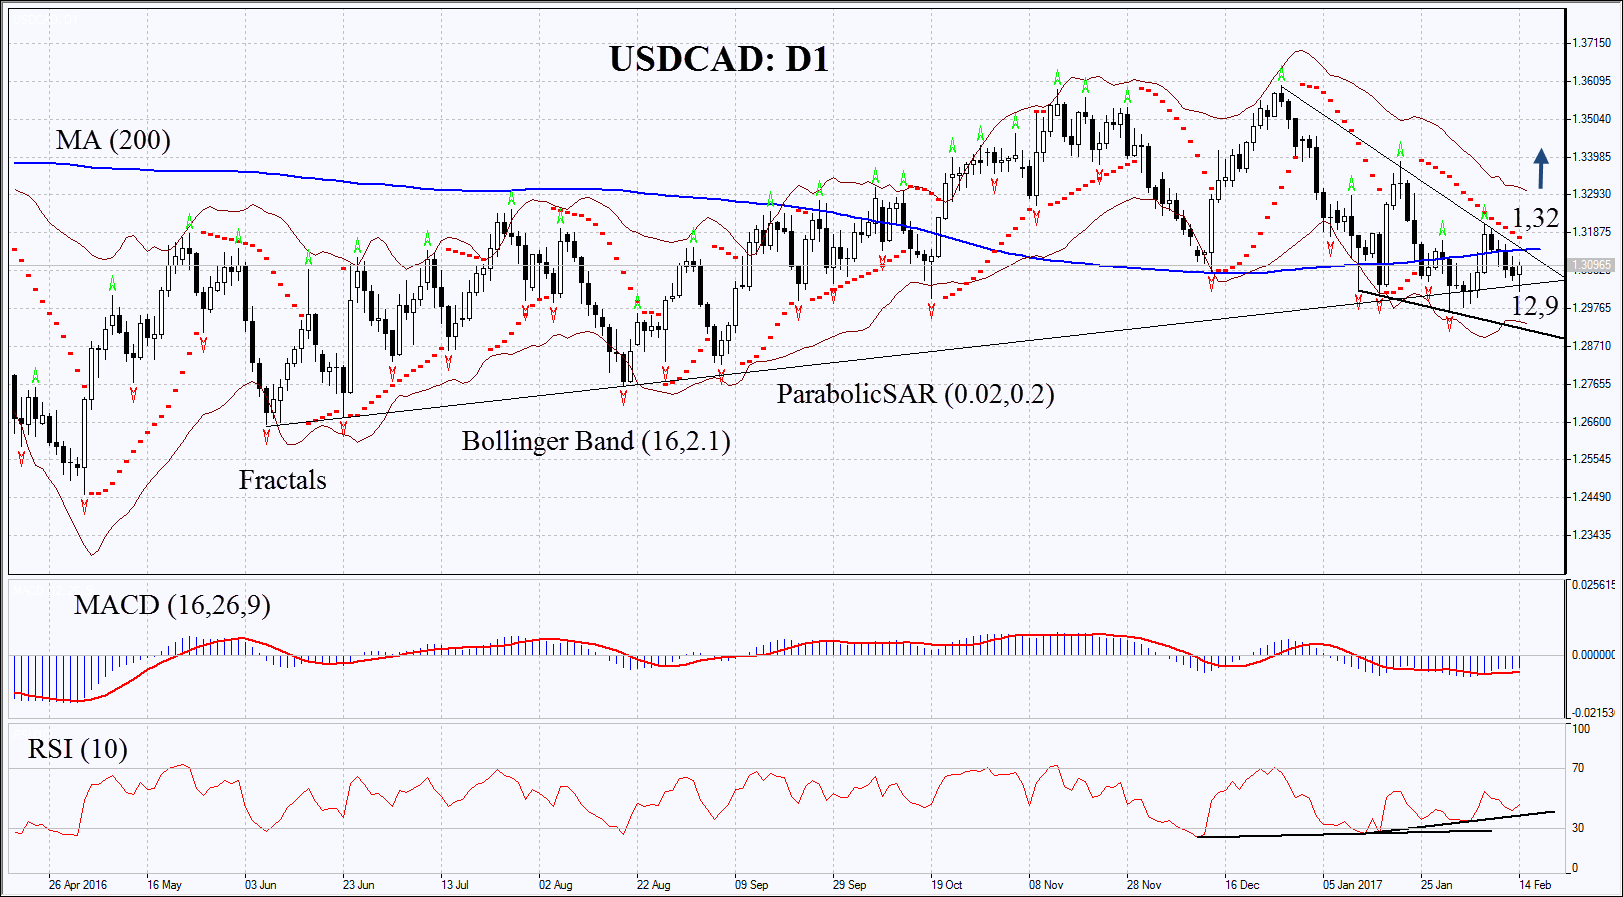
On the daily chart USDCAD: D1 is in downtrend. Its further increase is possible in case the pair leaves the trend to move upwards and in case the positive economic data comes out in US and weak in Canada.
- The Parabolic gives bearish signal.
- The Bollinger bands look usual which means low volatility.
- The RSI is below 50. It has formed positive divergence.
- The MACD is giving bullish signal.
The bullish momentum may develop in case the Canadian dollar surpasses the last fractal high, the resistance of the downtrend, the 200-day moving average and the Parabolic signal at 1.32. This level may serve the point of entry. The initial stop-loss may be placed below the Parabolic signal and the last fractal low at 1.29. Having opened the pending order we shall move the stop to the next fractal low following the Parabolic and Bollinger signals. Thus, we are changing the probable profit/loss ratio to the breakeven point. The most risk-averse traders may switch to the 4-hour chart after the trade and place there a stop-loss moving it in the direction of the trade. If the price meets the stop-loss level at 1.29 without reaching the order at 1.32, we recommend cancelling the position: the market sustains internal changes which were not taken into account.
Summary of technical analysis
| Position | Buy |
| Buy stop | above 1.32 |
| Stop loss | below 1.29 |
Explore our
Trading Conditions
- Spreads from 0.0 pip
- 30,000+ Trading Instruments
- Stop Out Level - Only 10%
Ready to Trade?
Open Account Note:
This overview has an informative and tutorial character and is published for free. All the data, included in the overview, are received from public sources, recognized as more or less reliable. Moreover, there is no guarantee that the indicated information is full and precise. Overviews are not updated. The whole information in each overview, including opinion, indicators, charts and anything else, is provided only for familiarization purposes and is not financial advice or а recommendation. The whole text and its any part, as well as the charts cannot be considered as an offer to make a deal with any asset. IFC Markets and its employees under any circumstances are not liable for any action taken by someone else during or after reading the overview.
