- Analytics
- Technical Analysis
USD/JPY Technical Analysis - USD/JPY Trading: 2014-10-29
Yen climbing
Here we consider the USD/JPYcurrency pair on the daily chart. The price is influenced by the daily uptrend, and after a slight retracement, we have all the more reason to believe in the bullish victory. The current price direction is confirmed by Parabolic historical values. There is no contradiction on the part of RSI-Bars oscillator: its values are moving upwards within the bullish trend. We can wait for an additional confirmatory signal from DonchianChannel after the breakout of the last fractal price level at 108.353. It will be preceded by the last high crossing at 58.5870% on the oscillator chart. It is recommended to use the level at 110.064 for placing a pending buy order. It is confirmed by the intersection with D1 and MN resistance lines and the Bill Williams fractal. When the price would cross the monthly resistance line, a strong bullish momentum is expected. Stop Loss is better to be placed at 105.163, which is strengthened by the intersection with the daily trend line, fractal and Parabolic historical values.
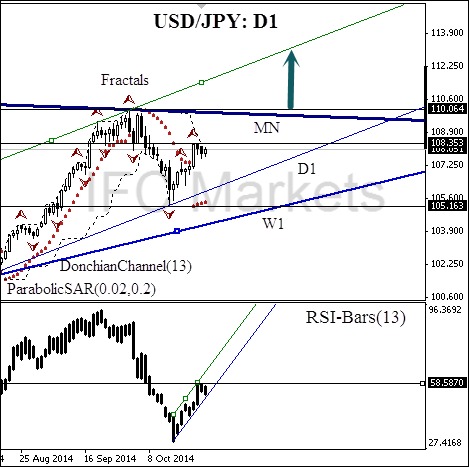
| Position | Buy |
| Buy stop | above 110.064 |
| Stop loss | below 105.163 |
Dear traders. You can see the detailed report of the author’s account by clicking here.
Explore our
Trading Conditions
- Spreads from 0.0 pip
- 30,000+ Trading Instruments
- Stop Out Level - Only 10%
Ready to Trade?
Open Account Note:
This overview has an informative and tutorial character and is published for free. All the data, included in the overview, are received from public sources, recognized as more or less reliable. Moreover, there is no guarantee that the indicated information is full and precise. Overviews are not updated. The whole information in each overview, including opinion, indicators, charts and anything else, is provided only for familiarization purposes and is not financial advice or а recommendation. The whole text and its any part, as well as the charts cannot be considered as an offer to make a deal with any asset. IFC Markets and its employees under any circumstances are not liable for any action taken by someone else during or after reading the overview.
