- Analytics
- Technical Analysis
USD/NOK Technical Analysis - USD/NOK Trading: 2019-10-23
Getting ready for the meeting of the Central Bank of Norway
Norges Bank is expected to leave its interest rate unchanged at 1.5% at its next meeting on October 24, 2019. Will the USDNOK quotations fall?
Moving down indicates strengthening of the Norwegian krone. Over the past 13 months, the Norwegian Central Bank has already raised the rate 4 times. It is practically the only one which did this, since the central banks of developed countries currently mainly reduce rates. Over the same 13 months, the Norwegian krone collapsed against the US dollar by almost 11% to an 18-year low. It is possible that the rate increase will help to strengthen.
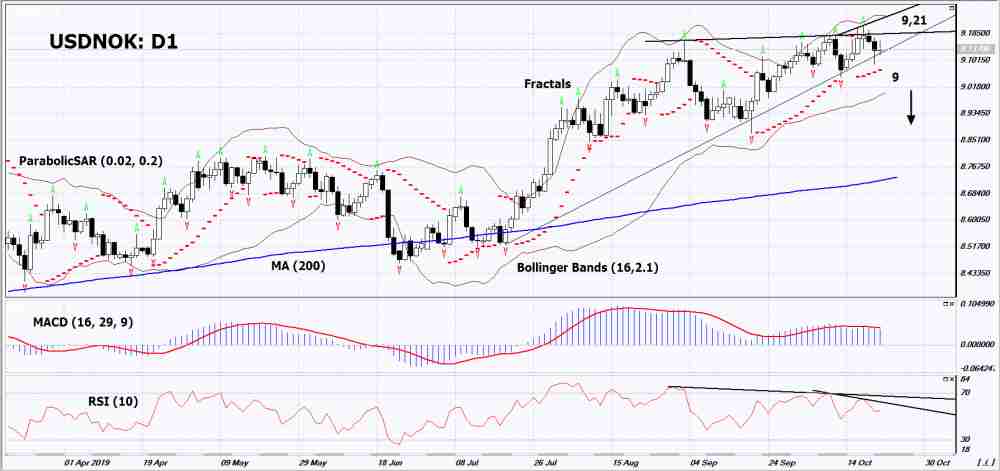
On the daily timeframe USDNOK: D1 approached the support line of the growing trend. Before opening a sell position, it must be broken down. Some technical analysis indicators formed a downward signal. A downward movement may form if the Central Bank of Norway rate and negative data in the USA are maintained.
- The Parabolic indicator demonstrates a signal to increase. It can be used as an additional support level, which must be broken down before opening a sell position.
- The Bolinger bands narrowed, indicating volatility decrease. Both Bollinger Lines have a downward slope.
- The RSI indicator is above the mark of 50. It has formed a double divergence to fall.
- The MACD indicator gives a bearish signal.
The bearish momentum may develop if USDNOK falls below the last lower fractal and the Parabolic signal: 9. This level can be used as an entry point. The initial stop lose should be placed higher than the last upper fractal and 18-year high: 9.21. After opening the pending order, the stop shall be moved following the Bollinger and Parabolic signals to the next fractal minimum. Thus, we are changing the potential profit/loss to the breakeven point. More risk-averse traders may switch to the 4-hour chart after the trade and place a stop loss moving it in the direction of the trade. If the price meets the stop level (9,21) without reaching the order (9), we recommend to cancel the order: the market sustains internal changes that were not taken into account.
Technical Analysis Summary
| Position | Sell |
| Sell stop | Below 9 |
| Stop loss | Above 9,21 |
Explore our
Trading Conditions
- Spreads from 0.0 pip
- 30,000+ Trading Instruments
- Stop Out Level - Only 10%
Ready to Trade?
Open Account Note:
This overview has an informative and tutorial character and is published for free. All the data, included in the overview, are received from public sources, recognized as more or less reliable. Moreover, there is no guarantee that the indicated information is full and precise. Overviews are not updated. The whole information in each overview, including opinion, indicators, charts and anything else, is provided only for familiarization purposes and is not financial advice or а recommendation. The whole text and its any part, as well as the charts cannot be considered as an offer to make a deal with any asset. IFC Markets and its employees under any circumstances are not liable for any action taken by someone else during or after reading the overview.
