- Analytics
- Technical Analysis
Wheat Ruble Technical Analysis - Wheat Ruble Trading: 2018-06-06
Winter wheat harvest started in the US
In this review, we suggest considering the personal composite instrument (PCI) “Wheat vs the Russian ruble". It reflects the price dynamics of wheat against the Russian ruble. Will WHEAT/RUB prices fall?
This movement means that wheat prices fall, and the Russian ruble strengthens. Now the winter wheat harvest began in the US. According to the U.S. Department of Agriculture (USDA), at the beginning of this week, 5% of the wheat area was harvested. This is a little more than the 5-year average level for the same date, which is 4%. It should be noted that weather conditions in the US are now very favorable for wheat. High world prices for hydrocarbon raw materials can contribute to the strengthening of the Russian ruble. The share of energy products in Russian exports is 65%.
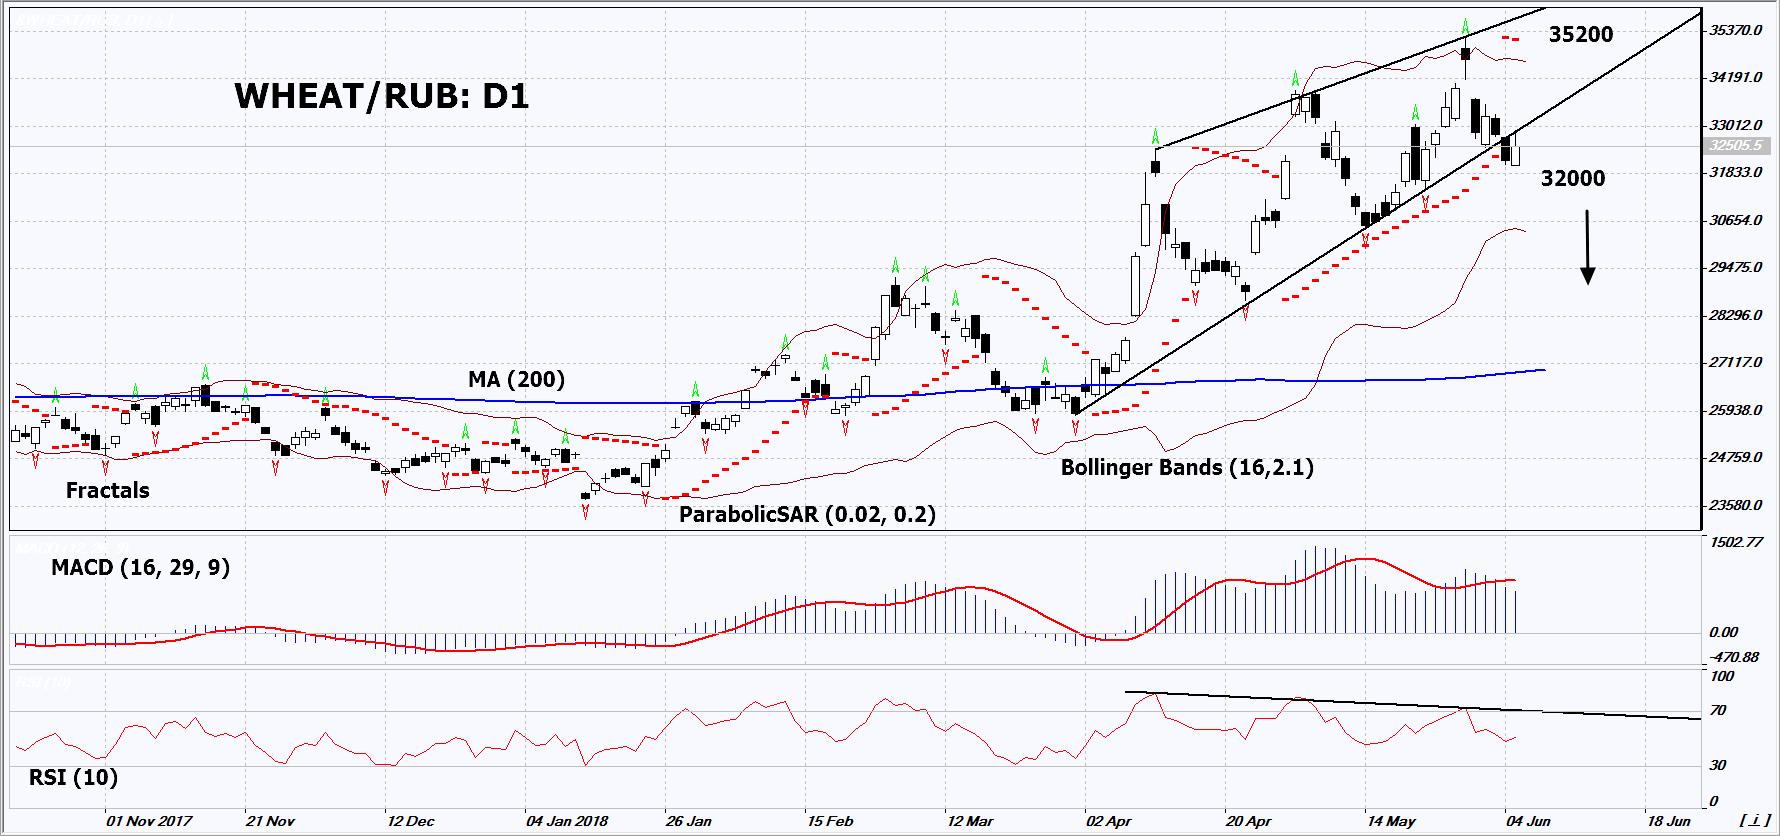
On the daily timeframe, WHEAT/RUB: D1 has breached down the support line of the uptrend. Good weather conditions in the US and consistently high world oil prices can contribute to the further price decrease.
- The Parabolic indicator gives a bearish signal.
- The Bollinger bands have widened, which indicates high volatility. They are titled downward.
- The RSI indicator is near 50. It has formed a negative divergence.
- The MACD indicator gives bearish signals.
The bearish momentum may develop in case WHEAT/RUB falls below its last low at 32000. This level may serve as an entry point. The initial stop loss may be placed above the last fractal high, the 2-year high, the upper Bollinger band and the Parabolic signal at 35200. After opening the pending order, we shall move the stop to the next fractal high following the Bollinger and Parabolic signals. Thus, we are changing the potential profit/loss to the breakeven point. More risk-averse traders may switch to the 4-hour chart after the trade and place there a stop loss moving it in the direction of the trade. If the price meets the stop level at 35200 without reaching the order at 32000, we recommend to close the position: the market sustains internal changes that were not taken into account.
Summary of technical analysis
| Position | Sell |
| Sell stop | Below 32000 |
| Stop loss | Above 35200 |
Explore our
Trading Conditions
- Spreads from 0.0 pip
- 30,000+ Trading Instruments
- Stop Out Level - Only 10%
Ready to Trade?
Open Account Note:
This overview has an informative and tutorial character and is published for free. All the data, included in the overview, are received from public sources, recognized as more or less reliable. Moreover, there is no guarantee that the indicated information is full and precise. Overviews are not updated. The whole information in each overview, including opinion, indicators, charts and anything else, is provided only for familiarization purposes and is not financial advice or а recommendation. The whole text and its any part, as well as the charts cannot be considered as an offer to make a deal with any asset. IFC Markets and its employees under any circumstances are not liable for any action taken by someone else during or after reading the overview.
