- Analytics
- Technical Analysis
WHEAT Technical Analysis - WHEAT Trading: 2016-01-04
Worse weather may affect crops forecasts
On December 30, 2015 the wheat prices edged up for the second straight day after they failed to hit a new 5-year low. Investors are concerned with worse weather in the US and other countries cultivating this crop. The abnormally warm start of the winter increased the chances El Nino will form in spring 2016. The effect may reduce crops significantly. Will the wheat prices continue edging up?
The US National Weather Service reported the higher risk of floods in Western Missouri and Southern Illinois. 13 people already died in these stated due to the extremely bad weather conditions and storms. Note, that Missouri, Illinois and Arkansas account for about 25% of winter wheat crops in the US. It is sowed in autumn and harvested in June and July. According to University of Illinois agronomist, the vast majority of wheat crops may fail in case the floods last more than a week. The IKAR agency stated the winter wheat crops forecast may be revised down for Russia due to the cold snap after extremely warm weather in December. The same difficulties may arise in the nearby Ukraine. Some meteorologists believe the ingoing El Nino may become the strongest in 100 years.
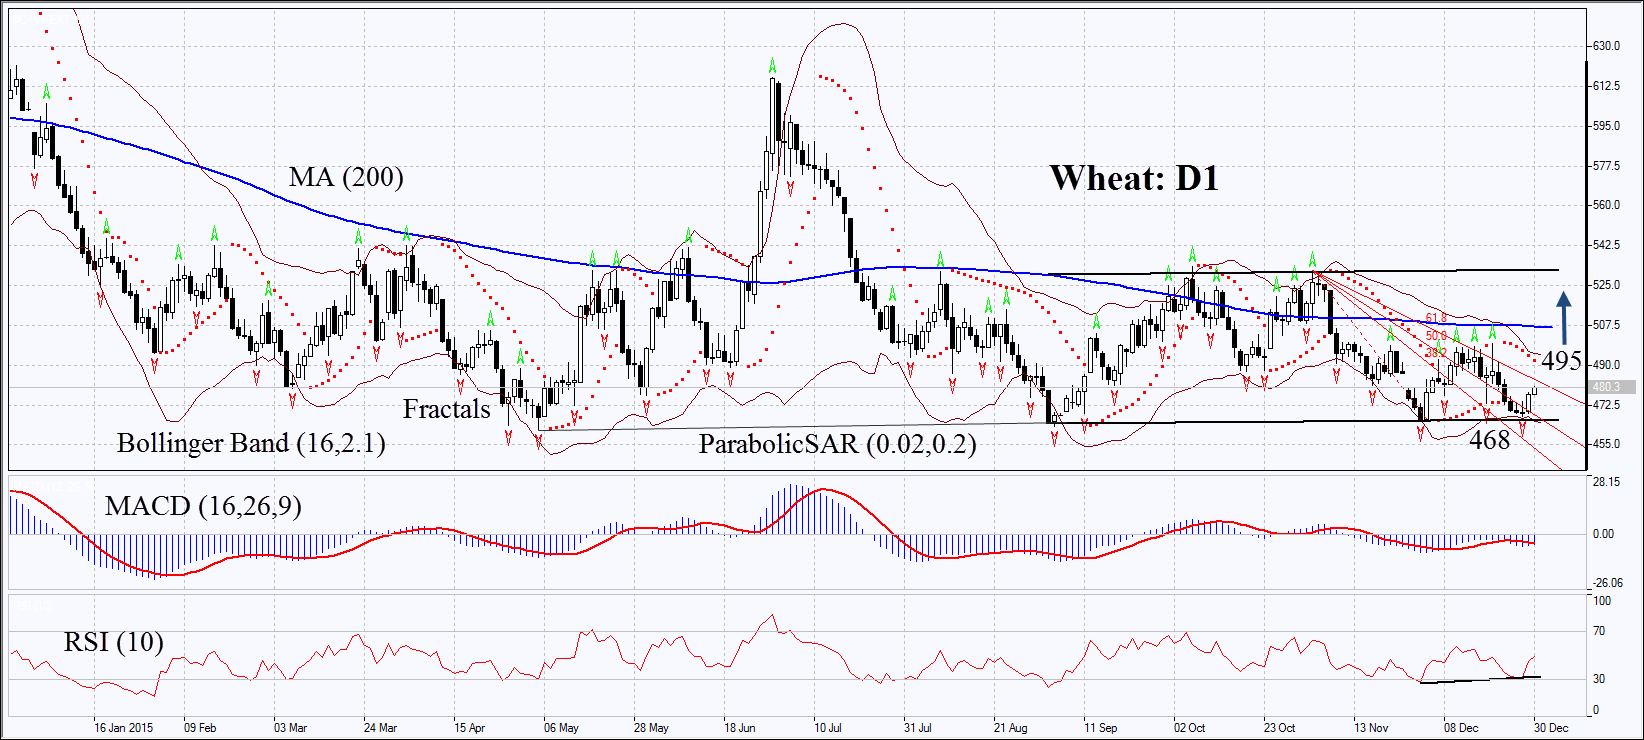
On the daily chart Wheat: D1 has been moving sideways for almost half a year. It has recently tested the support line and then corrected upwards. The Parabolic and MACD indicators do not yet give buy signals. The Bollinger bands have contracted which may mean lower volatility. RSI has formed positive divergence. The bullish momentum may develop in case the wheat prices surpass the upper Parabolic signal and Bollinger band at 495. This level may serve the point of entry. The initial risk-limit may be placed below the Bollinger band and the last fractal low at 465. Having opened the pending order we shall move the stop to the next fractal low following the Parabolic and Bollinger signals. Thus, we are changing the probable profit/loss ratio to the breakeven point. The most risk-averse traders may switch to the 4-hour chart after the trade and place there a stop-loss moving it in the direction of the trade. If the price meets the stop-loss level at 465 without reaching the order at 495, we recommend cancelling the position: the market sustains internal changes which were not taken into account.
| Position | Buy |
| Buy stop | above 495 |
| Stop loss | below 465 |
- Get Certificate

Note:
This overview has an informative and tutorial character and is published for free. All the data, included in the overview, are received from public sources, recognized as more or less reliable. Moreover, there is no guarantee that the indicated information is full and precise. Overviews are not updated. The whole information in each overview, including opinion, indicators, charts and anything else, is provided only for familiarization purposes and is not financial advice or а recommendation. The whole text and its any part, as well as the charts cannot be considered as an offer to make a deal with any asset. IFC Markets and its employees under any circumstances are not liable for any action taken by someone else during or after reading the overview.
