- Analytics
- Technical Analysis
Gold vs. USD Technical Analysis - Gold vs. USD Trading: 2018-02-05
Gold prices are dropping amid the strengthening of the dollar
On Friday, positive labor market data were published in the US, which increased the chances of a Fed rate hike and supported the strengthening of the US dollar. Will the gold quotes decrease?
In January, the number of the US Nonfarm payrolls increased by 200 thousand, which is noticeably better than the preliminary forecast of +180 thousand. The wage increase in annual terms was the highest since 2009 and amounted to 2.9%. In absolute terms, the average wage level in the US reached $26.74 per hour. Amid positive economic statistics, investors are confident in a Fed rate hike at its next meeting, which will take place on March 21, 2018. As a rule, gold quotes and the dollar index move in opposite directions. Investors consider gold a haven asset when the rate of the US assets decreases. Another factor in a decrease of gold prices may be a reduction in the assets of the world's largest hedge fund SPDR Gold Shares. According to the results of this week, it may occur for the first time in the last 3 weeks.
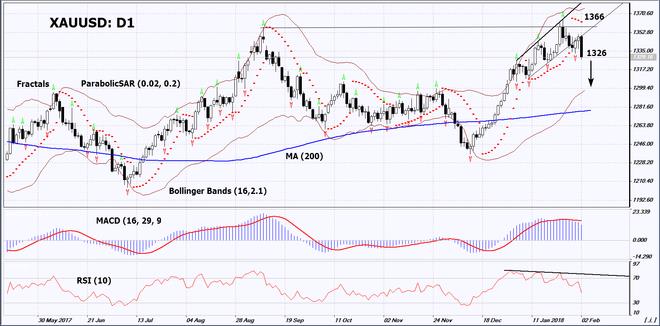
On the daily timeframe, XAUUSD: D1 reached the previous top of the wide, neutral range and could not breach it up. A downward movement is possible in case of a further strengthening of the US dollar.
- The Parabolic indicator gives a bearish signal.
- The Bollinger bands have widened, which means higher volatility.
- The RSI indicator is below 50. It has formed a negative divergence.
- The MACD indicator gives a bearish signal.
The bearish momentum may develop in case XAUUSD drops below its last low at 1326. This level may serve as an entry point. The initial stop loss may be placed above the last fractal high, the 1.5-year high and the Parabolic signal at 1366. After opening the pending order, we shall move the stop to the next fractal high following the Bollinger and Parabolic signals. Thus, we are changing the potential profit/loss to the breakeven point. More risk-averse traders may switch to the 4-hour chart after the trade and place there a stop loss moving it in the direction of the trade. If the price meets the stop level at 1366 without reaching the order at 1326, we recommend cancelling the position: the market sustains internal changes that were not taken into account.
Summary of technical analysis
| Position | Sell |
| Sell stop | below 1326 |
| Stop loss | above 1366 |
Explore our
Trading Conditions
- Spreads from 0.0 pip
- 30,000+ Trading Instruments
- Stop Out Level - Only 10%
Ready to Trade?
Open Account Note:
This overview has an informative and tutorial character and is published for free. All the data, included in the overview, are received from public sources, recognized as more or less reliable. Moreover, there is no guarantee that the indicated information is full and precise. Overviews are not updated. The whole information in each overview, including opinion, indicators, charts and anything else, is provided only for familiarization purposes and is not financial advice or а recommendation. The whole text and its any part, as well as the charts cannot be considered as an offer to make a deal with any asset. IFC Markets and its employees under any circumstances are not liable for any action taken by someone else during or after reading the overview.
