- Analytics
- Technical Analysis
Gold Ruble Technical Analysis - Gold Ruble Trading: 2019-09-25
Further rate cuts could increase the attractiveness of precious metals
In this review, we suggest to take into consideration a personal composite instrument (PCI) & XAURUB. It reflects the dynamics of changes in the value of gold VS Russian ruble. Will the XAURUB quotations grow?
Such movement indicates gold price increase and Russian ruble decline. The main factors behind the rise in price of precious metals are the softening of the monetary policy of the world's leading central banks against the backdrop of signs of a slowdown in global economic growth. So, the Fed rate reduction is expected at the next meeting on October 30, 2019. Meanwhile, now it is 2%, which is lower than current inflation in the US 2.4% in annual terms. In addition, the demand for gold is supported by global risks in the form of a trade war between China and the USA, the aggravation of the situation around Iran, as well as the problems of the budget crisis in Italy and the British exit from the EU. In turn, the weakening of the Russian ruble may occur after the end of the period for the payment of taxes or in the event of a decrease in world oil prices. In Russian exports, the share of hydrocarbons reaches 70%.
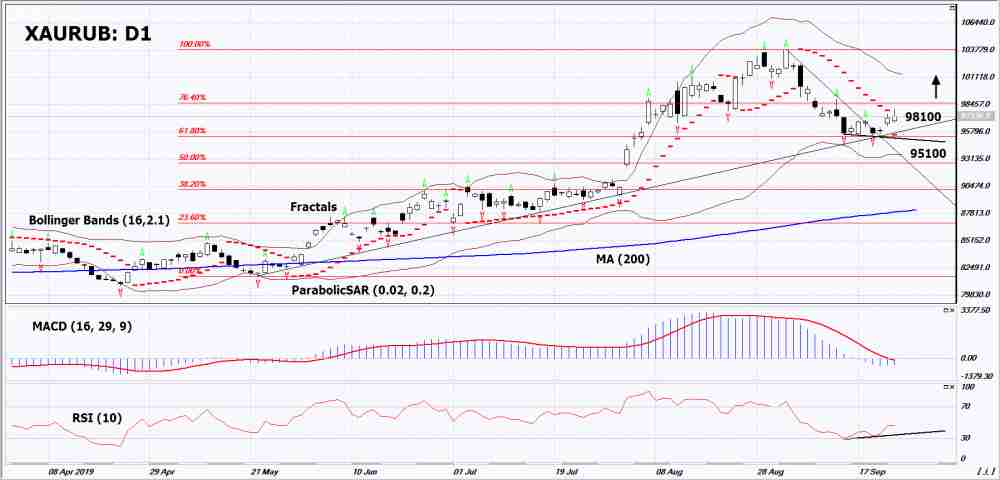
On the daily timeframe XAURUB: D1 could not break the support line of the uptrend as part of the correction. Now the upward movement may resume. Various technical analysis indicators have generated uptrend signals. Further growth of quotations is possible in the case of increasing global risks and a slowdown in the global economy.
- The Parabolic indicator demonstrates a signal to increase.
- The Bolinger bands narrowed, indicating a volatility decrease.
- The RSI indicator is below the 50 mark. It has formed a divergence to increase.
- The MACD indicator gives a bullish signal.
The bullish momentum may develop if XAURUB exceeds its last maximum: 98100. This level can be used as an entry point. The initial stop lose may be placed below the last lower fractal, the 2nd Fibonacci level and the Parabolic signal: 95100. After opening a pending order, the stop shall be moved following the Bollinger and Parabolic signals to the next fractal minimum. Thus, we are changing the potential profit/loss to the breakeven point. More risk-averse traders may switch to the 4-hour chart after the trade and place a stop loss moving it in the direction of the trade. If the price meets the stop level (95100) without reaching the order (98100), we recommend to cancel the order: the market sustains internal changes that were not taken into account.
Technical Analysis Summary
| Position | Buy |
| Buy stop | Above 98100 |
| Stop loss | Below 95100 |
Explore our
Trading Conditions
- Spreads from 0.0 pip
- 30,000+ Trading Instruments
- Stop Out Level - Only 10%
Ready to Trade?
Open Account Note:
This overview has an informative and tutorial character and is published for free. All the data, included in the overview, are received from public sources, recognized as more or less reliable. Moreover, there is no guarantee that the indicated information is full and precise. Overviews are not updated. The whole information in each overview, including opinion, indicators, charts and anything else, is provided only for familiarization purposes and is not financial advice or а recommendation. The whole text and its any part, as well as the charts cannot be considered as an offer to make a deal with any asset. IFC Markets and its employees under any circumstances are not liable for any action taken by someone else during or after reading the overview.
